Real Estate Information Archive

Blog

Displaying blog entries 31-40 of 67

Chester County PA Real Estate Market Trends for July 2017

by Scott Darling

Chester County PA Real Estate Market Trends for July 2017

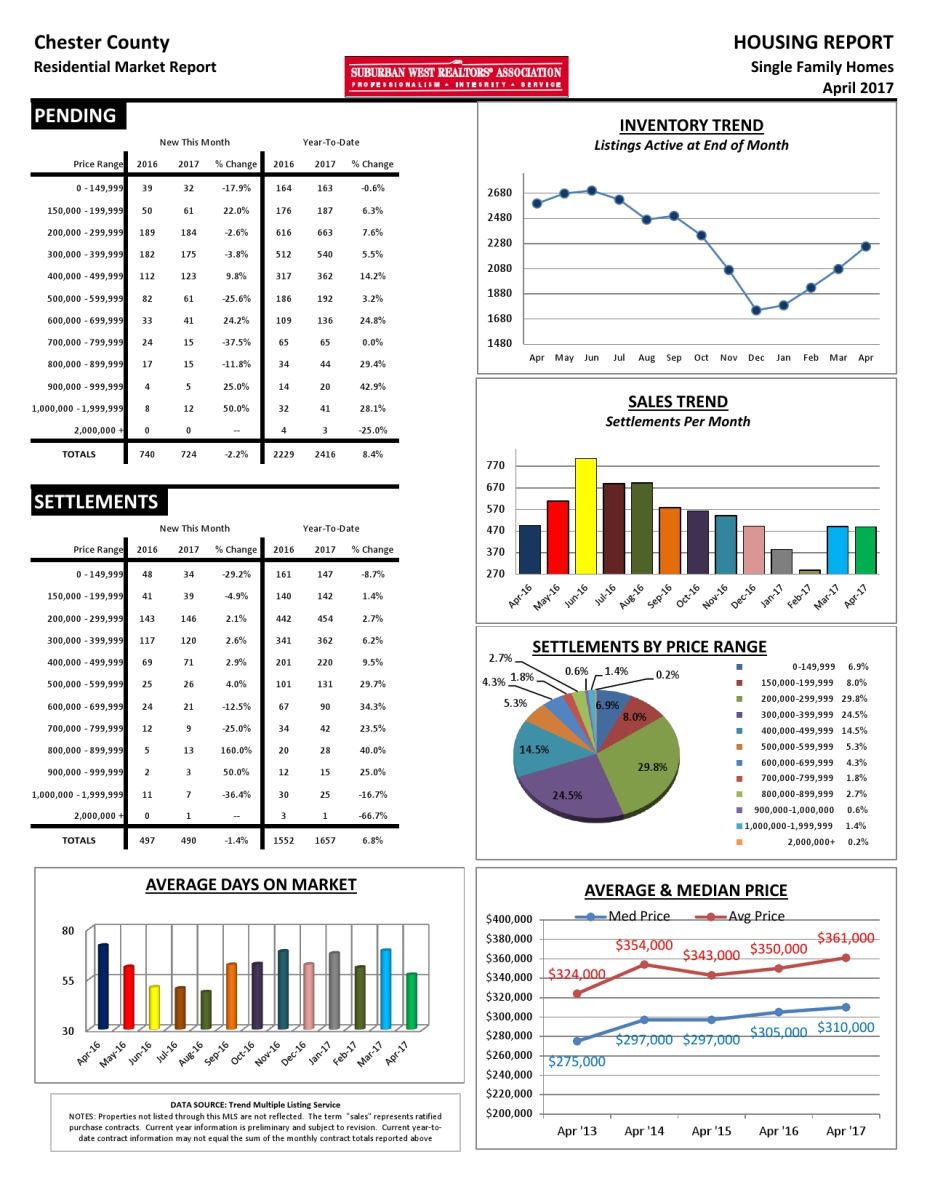
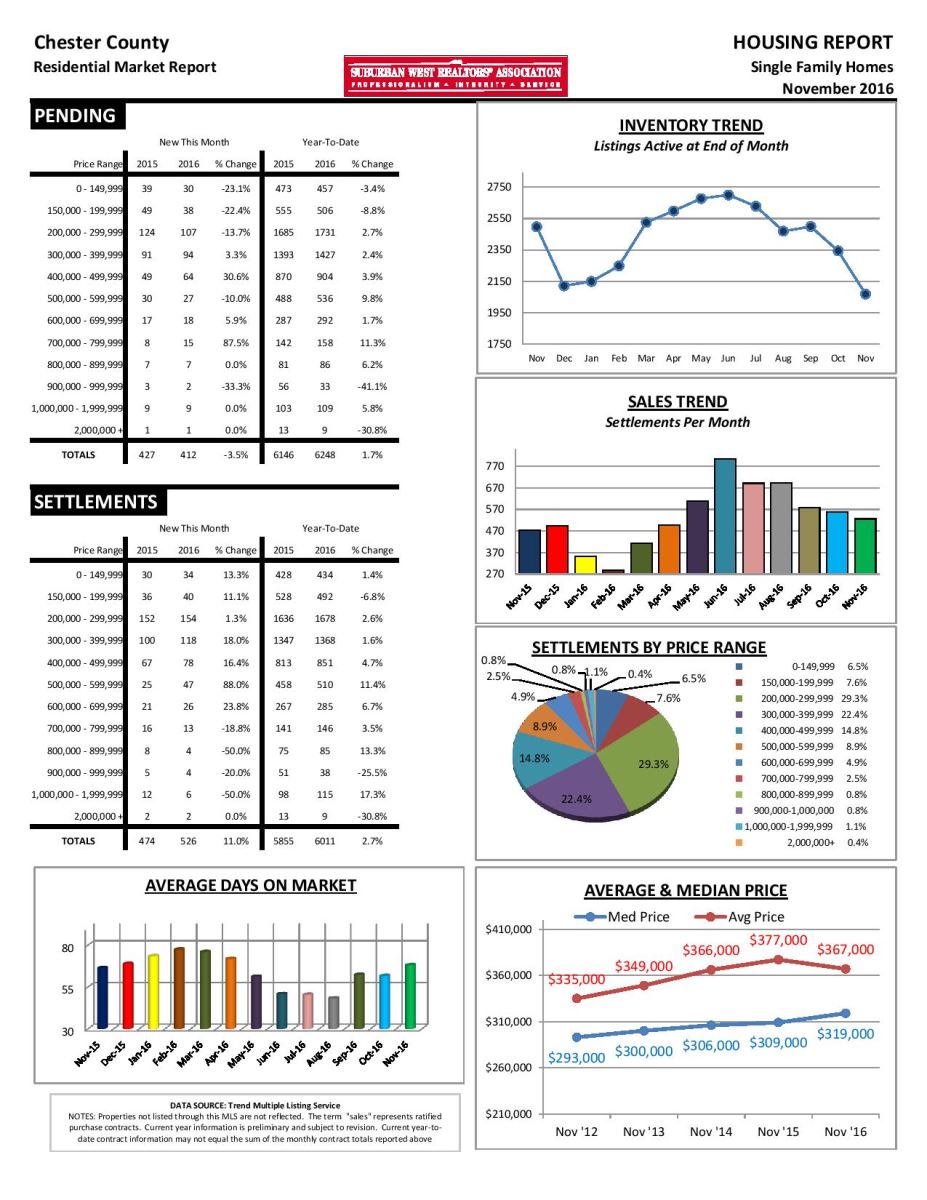
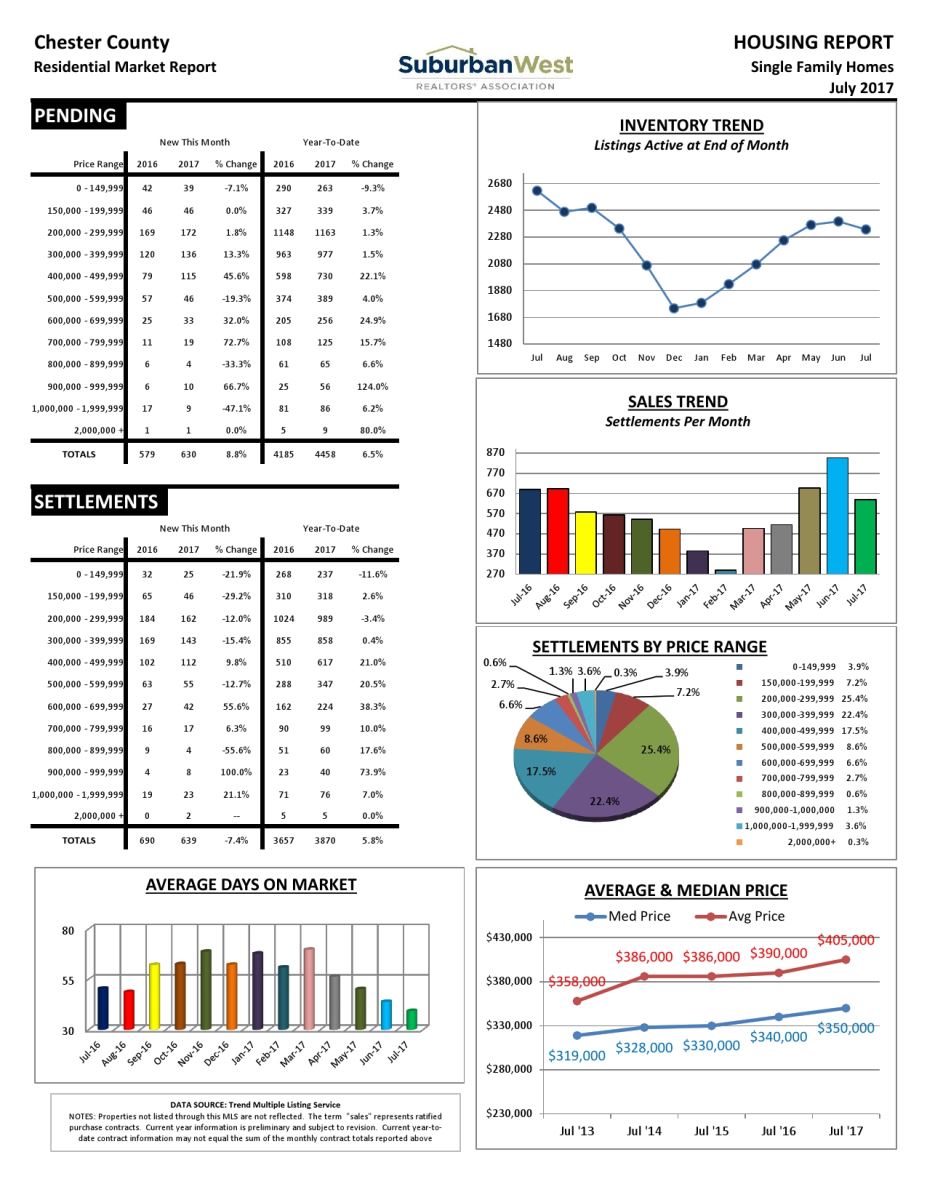
Chester County PA single family homes saw pending sales increase by 8.8% in July 2017 when compared to July 2016. 639 homes sold in July with a median sales price of $350,000, a 2.9% increase from July 2016.  The average sales price increased by 3.8%, and homes were on the market 20 days less.

If you are thinking about selling your home get a free instant home evaluation Learn More

Chester County PA Real Estate Market Trends for May 2017

by Scott Darling

Chester County PA Real Estate Market Trends for May 2017

Chester County PA single family homes saw pending sales increase by 12.4% in May 2017 when compared to May 2016. 663 homes sold in May with a median sales price of $333,000, a 5.71% increase from May 2016.  The average sales price increased by 4.8%, and homes were on the market 10 days less.

If you are thinking about selling your home get a free instant home evaluation Learn More

Chester County PA Real Estate Market Trends for April 2017

by Scott Darling

Chester County PA Real Estate Market Trends for April 2017

Chester County PA single family homes saw pending sales decrease by 2.2% in April 2017 when compared to April 2016. 490 homes sold in April with a median sales price of $310,000, a 1.64% increase from April 2016.  The average sales price increased by 3.1%, and homes were on the market 15 days less.

If you are thinking about selling your home get a free instant home evaluation Learn More

Chester County PA Real Estate Market Trends for March 2017

by Scott Darling

Chester County PA Real Estate Market Trends for March 2017

Chester County PA single family homes saw pending sales increase by 11.2% in March 2017 when compared to March 2016. 454 homes sold in March with a median sales price of $310,000, a 10.71% increase from March 2016.  The average sales price increased by 5.3%, and homes were on the market 5 days less.

If you are thinking about selling your home get a free instant home evaluation Learn More

Chester County Market Trends Report February 2017

by Scott Darling

Chester County PA Real Estate Market Trends for February 2017

Chester County PA single family homes saw pending sales increase by 3.6% in February 2017 when compared to February 2016. 270 homes sold in February with a median sales price of $300,000, a 9.1% increase from February 2016.  The average sales price increased by 2.4%, and homes were on the market 5 days less.

Chester County Market Trends Report January 2017

by Scott Darling

Chester County PA Real Estate Market Trends for January 2017

Chester County PA single family homes saw pending sales increase by 38.05% in January 2017 when compared to January 2016. 363 homes sold in January with a median sales price of $296,000, a 1.99% decrease from January 2016.  The average sales price decreased by 6.23%, and homes were on the market 5 days more.

Chester County PA Real Estate Market Trends for December 2016

by Scott Darling

Chester County PA single family homes saw pending sales decrease by 6.7% in December 2016 when compared to December 2015. 493 homes sold in December with a median sales price of $310,000, a 6.89% increase from December 2015.  The average sales price increased by 3.21%, and homes were on the market 5 days less.

Chester County PA Real Estate Market Trends for November 2016

by Scott Darling

Chester County PA single family homes saw pending sales decrease by 3.5% in November 2016 when compared to November 2015. 526 homes sold in November with a median sales price of $319,000, a 3.13% increase from November 2015.  The average sales price increased by 11.0%, and homes were on the market 10 days more.

Chester County PA Real Estate Market Trends for October 2016

by Scott Darling

Chester County PA Real Estate Market Trends for October 2016

Chester County PA single family homes saw pending sales increase by 18.25% in October 2016 when compared to October 2015. 494 homes sold in October with a median sales price of $325,000, a 7.69% increase from October 2015.  The average sales price increased by 12.73%, and homes were on the market 1 day fewer.

The Quality of RE/MAX Agents Is On Display Once Again

by Scott Darling

remax

In the 2016 Franchise Times 200 ranking released recently, RE/MAX not lead all real estate brands for the eighth consecutive year, but also climbed to the Top 10 overall – in 8th place ahead of household names such as Marriott, Wendy’s, and Domino's.

Displaying blog entries 31-40 of 67

Syndication

Categories

Archives