Being a homeowner means that your home is yours – even the things that need fixing. Is a faucet leaking? Are floor boards squeaky? Is a light-switch not working? Those issues are all yours to tackle. But what projects can you do yourself and what ones require the help of a trained professional? Taking on projects yourself can save you time and money. But taking on the wrong projects can lead to unending amounts of stress or end up costing you more money than if you had hired someone in the first place. NAR’s consumer website, HouseLogic.com, lets you know which projects need a seasoned hand and a beginner can undertake.
Take a look at how many families decided to become homeowners in our local market in August…
Chester County PA Real Estate Market Trends for August 2016
2,641 Chester County PA single family homes were for sale in August 2016 which is an 8.42% decrease from August 2015. 687 homes sold in August with a median sales price of $351,000, a 8.00% increase from August 2015.
The supply of inventory was 5.0 compared to 5.6 in August 2015 and the Sales vs List Price was 96.3%.
Decisions made by the next President and Congress could change the way Americans buy and sell homes for generations to come. Rising prices are making it more difficult for working families and young adults to become homeowners. Government control over the vast majority of mortgages through Freddie Mac and Fannie Mae unnecessarily exposes taxpayers to risk and continue to stifle the innovation of new lending products that responsible borrowers need and want.
More business as usual?
Depending on who is elected this year’s presidential election could either deliver a mandate for Washington to act on far-reaching reforms integral to our system of housing finance or bring more business as usual.
Here are the priorities Americans want the next President and Congress to address, according to a new research conducted for loanDepot, the nation’s second largest nonbank consumer lender:
* Make homeownership more affordable for middle- and lower-income families (37 percent).
* Keep interest rates low, especially during the first 100 days of the new presidency (34 percent).
* Make more credit available to small businesses (11 percent).
Few see the election improving their pocketbooks
Most Americans expect their personal financial situation to either stay the same or get worse when new leaders take over the White House and Congress. Only 6 percent think that they will be better off as a result of the election.
Each vote counts
One out of every five Americans said the candidates’ housing and finance policies will influence their vote. Another 40 percent have not yet made up their minds. That is because only 9 percent think the candidates have done a good job articulating their positions on the economic issues that affect peoples’ daily lives.
Perception doesn’t match reality
Some 77 percent think it is just as hard or even harder to get a loan today than during the Great Recession eight years ago. Young adults may be more discouraged than most; they worry about not making enough money and nearly half (46 percent) fear the election outcome will make it even harder to get a loan.
In fact, while guidelines have tightened since 2008, applications for purchase mortgages were more likely to be denied in 2008 than in 2014, the most recent year for which Federal Reserve data is available. Denial rates for home purchase loan applications hit 18 percent in 2008, while denials in 2014 topped out at 13 percent. Denial rates for home refinance applications in 2008 were 38 percent and dropped to 31 percent in 2014.
Find out if you qualify for a home loan
Getting into the home of your dreams may be easier than you think. All you have to do is get pre-qualified by the local lender of your choice. Don’t know a lender? Contact us and we’ll be glad to recommend someone.
Fifty-two percent of home owners say now is a good time to sell in their neighborhood. This is up from 34 percent who said so last year, according to a survey conducted by the real estate brokerage Redfin.
What’s more, 58 percent of home owners believe sellers have more power than buyers in the market right now. Redfin researchers note this is nearly the highest level of seller confidence they’ve recorded.
Take a look at how many sellers successfully sold their homes in July…
Chester County PA Real Estate Market Trends for July 2016
2,977 Chester County PA single family homes were for sale in July 2016 which is a 6.54% increase from July 2015. 781 homes sold in July with a median sales price of $345,000, a 1.47% increase from July 2015.
The supply of inventory was 5.8 compared to 5.3 in July 2015 and the Sales vs List Price was 95.6%.
FHA has recently relaxed many of its condo financing rules making it easier for condo buyers to secure loan when buying a condo. If you are in the market for a condo be sure to talk with your lender about how the new rules may help you.
Chester County PA Real Estate Market Trends for June 2016
3,045 Chester County PA single family homes were for sale in June 2016 which is a 6.43% increase from June 2015. 801 homes sold in June with a median sales price of $340,000, a 2.01% decrease from June 2015.
The supply of inventory was 6.1 compared to 5.3 in May 2015 and the Sales vs List Price was 96.4%.
When putting a home on the market, there is a lot to consider. How will you find a REALTOR®? What should you price the home? And the big one—is the home ready to sell? Most sellers know to get rid of clutter and fix any big or obvious problems. But what else can sellers do to get top dollar for their home? The National Association of REALTORS has identified some staging tips for various rooms in a home. After all, NAR research shows that 81 percent of buyers believe it is easier for them to picture themselves in a home when it’s staged. To appeal to those buyers, NAR recommends scrubbing the fireplace, focusing on symmetry in decoration, packing up dishes that don’t match your main set in your cupboards, making the extra bedroom a fun activity room to showcase other functions (like a sewing room or office), and keeping all closets as empty as possible.
Check out how many local sellers were successful selling their homes in May:
Chester County PA Real Estate Market Trends for May 2016
2,984 Chester County PA single family homes were for sale in May 2016 which is a 6.76% increase from May 2015. 557 homes sold in May with a median sales price of $324,000, a 0.30% decrease from May 2015.
The supply of inventory was 6.1 compared to 5.2 in May 2015 and the Sales vs List Price was 95.9%.
2,719 Chester County PA single family homes for sale in April 2016 which is a 1.98% decrease from April 2015. 485 homes sold in April with a median sales price of $310,000, a 6.41% decrease from April 2015.
The supply of inventory is 5.1 compared to 5.7 in April 2015 and the Sales vs List Price is 9347%.
According to the National Association of Realtors, mortgage rates are now lower than they ended in March. That means that rates are not only near the lows for the year to date, they are also close to the lowest rates in three years. These lower rates translate into increased buying power and/or improved ability to qualify for a mortgage.
A record number of Americans are actively searching and looking at the current inventory on Realtor.com®. We currently have 2% fewer homes for sale in the U.S. relative to last year, but we’ve seen 137,000 new listings come onto the market so far in April.
Looking ahead, great weather will likely draw even more people to look at open houses and available homes over the rest of the month. According to Cleveland Research, after a cooler than normal start to April, the weather forecast for the next 10 days is expected to be “near perfect” across many of the largest housing markets in the country, especially in the central and eastern U.S.
But who cares about a national or regional weather or housing forecast? What matters most are the trends and conditions in your neighborhood.
Chester County PA Real Estate Market Trends for February 2016
2,614 Chester County PA single family homes for sale in March 2016 which is a 4.47% increase from March 2015. 405 homes sold in March with a median sales price of $280,000, a 0.70% decrease from March 2015.
The supply of inventory is 5.0 compared to 5.2 in March 2015 and the Sales vs List Price is 93.7%.
Homeowners looking to sell and move to a new place are in a great position; according to the National Association of REALTORS®’ 2015 Profile of Home Buyers and Sellers, sellers are seeing the sales price of their home creep up closer to list price—the median sales price as a percent of the listing price is 98 percent. Just a few years ago, in 2011, owners were selling their home for 95 percent of the list price. The amount of time a property sits on the market also matters in the sales price compared to the listing price. For homes that lasted less than a week on the market, half were sold for full listing price, while another 19 percent were sold for more than that price. The sale-to-list price ratio falls as time goes on (for example, homes that are on the market for 5-8 weeks are only sold for 100 percent of the listing price 17 percent of the time and more than listing price only 3 percent of the time).
Take a look at how many successful home sellers there were in our market in February:
Chester County PA Real Estate Market Trends for February 2016
2,416 Chester County PA single family homes for sale in February 2016 which is a 4,67% increase from February 2015. 276 homes sold in February with a median sales price of $305,000, a 6.72% decrease from February 2015.
The supply of inventory is 4.5 compared to 4.9 in February 2015 and the Sales vs List Price is 93.2%.
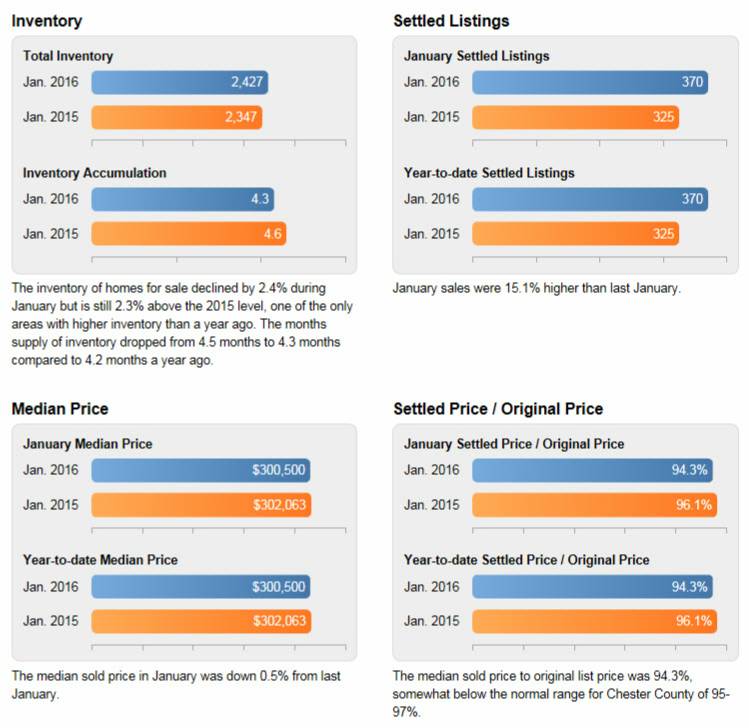
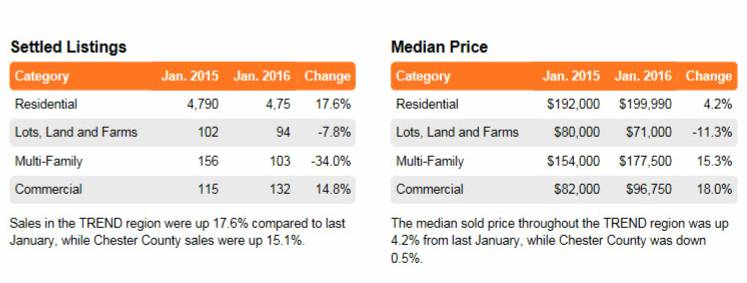
Sales were 15.1% higher than in January 2015 while the median sold price was down 0.5% compared to January 2015.
Residential activity in Chester County (Single-family and Condo)
What's happening in the Local Market?
Sales in January were considerably higher than expected, exceeding 2015 by 17%. Additionally, the median sales price was 4% higher than a year ago. The sales price increase is not too surprising since most forecasts were for a 3-4% increase in prices this year over 2015. Of course, one month does not a year make. For February we are projecting about a 10% increase in sales. Pending sales, usually a good indication of sales to come over the next month or two, were 6% ahead of last year in January; that’s in line with the experts expectations of a 3-5% sales increase for 2016. Inventory is beginning to build and it looks like a strong spring market ahead.