Real Estate Information Archive

Blog

Displaying blog entries 31-40 of 81

Chester County Market Trends Report - December 2015

by Scott Darling

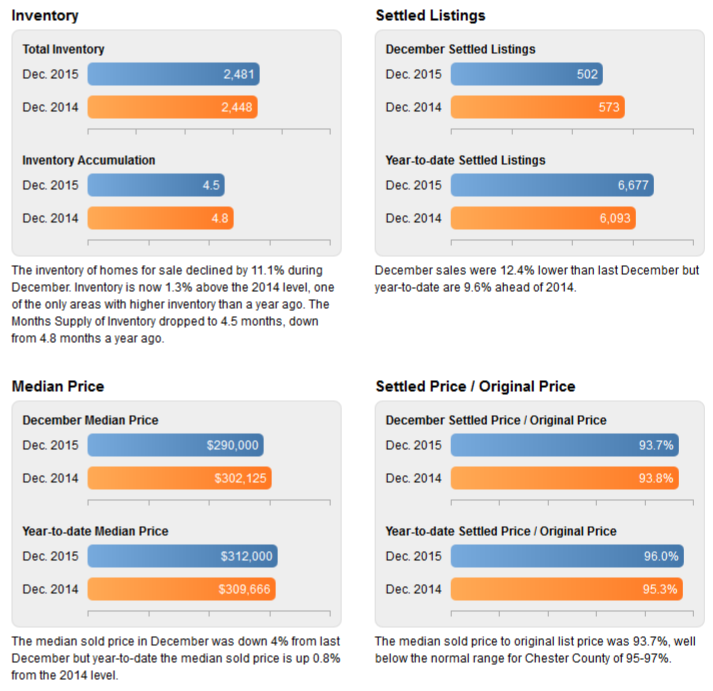
Although Sales increased from last month, they were 12.4% below December 2014. The median sold price was down 4% ($12,125) compared to December 2014.

Residential activity in Chester County (Single-family and Condo)


chester county real estate

What's happening in the Local Market?

Just how good was the 2015 housing market? Although there was a slight slowdown in Q4 of 2015, sales were still 6% higher than Q4 2014. The median sold price, however, was unchanged from Q4 2014. Looking ahead to 2016, most national forecasts are for sales increases of 5% and price increases of 4% in 2016.

chester county real estate

Curious about the value of your home? Get your home's value here!

Chester County PA Real Estate Market Trends - November 2015

by Scott Darling

Realtor.com has ranked the HOTEST Real Estate Markets in November. The temperatures may be dropping but California real estate is hot, hot, hot scoring 12 of the top 20 spots with San Francisco as #1. The good news for the rest of the country is trends always seem to start in California and move eastward. This bodes well for our local market in 2016!

Residential activity in Chester County (Single-family and Condo)


chester county real estate

chester county real estate
 

What's happening in the Local Market?

November was right where expected, sales up, but not by as much as we’ve been seeing, and prices level. Year-to-date sales are up 14% and median sales price is up 2%. Looking ahead to next year as predictions from experts begin to appear: more of the same. Strongest headwinds are low inventory and the probability of mortgage rates increasing, although it’s unlikely that the expected increase to 4.5% by the end of 2016 will adversely impact home sales.

chester county real estate


Curious about the value of your home? Get your home's value here!

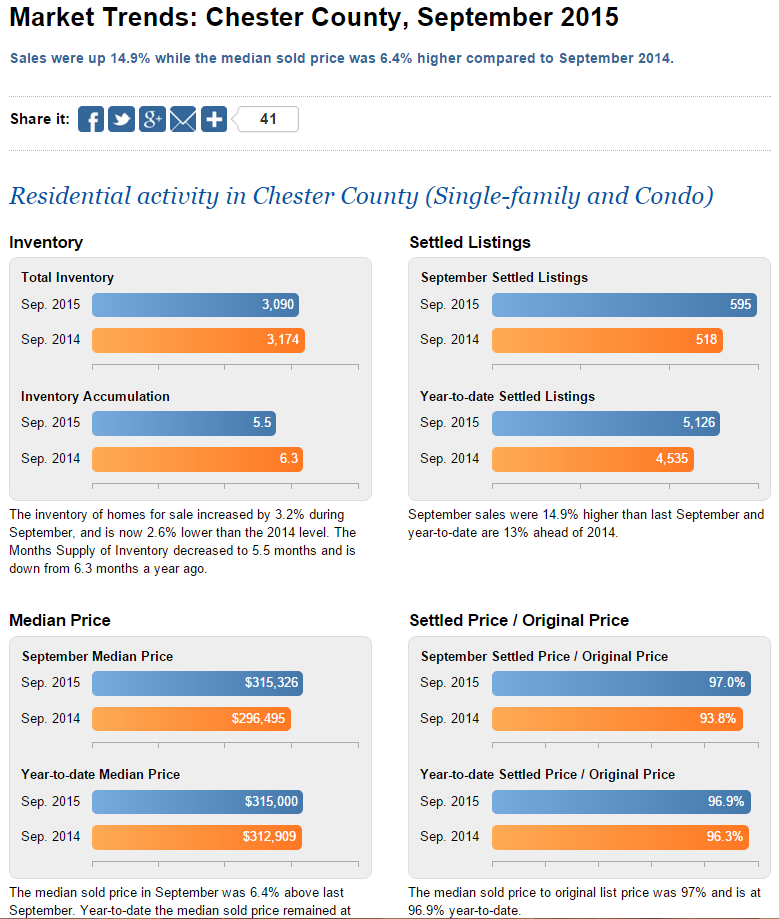
Real Estate Market Trends for Chester County PA - September 2015

by Scott Darling

christmas dog

Moving into a new home during the holidays can be difficult and stressful. There are so many things to plan and prepare when it comes to either event, but to combine the two is extremely difficult. How are you going to celebrate the holidays while you are packing up your home?

If you stay on top of the process you can enjoy the holidays despite your move. Here are some ways you can do both!

  • New Traditions - You might be used to big, homemade meals around the dining room table, but maybe you change it up a bit.  Look for businesses that are open on that day and eat out or order in.  You can have the same sort of meal or you can go completely out of the box. This allows you to pack up your kitchen beforehand so you can enjoy the day more.
  • Create a Move Zone - Keep your jovial, holiday spirit separate from the pile of moving boxes and clutter by creating a moving zone. Put all of your boxes and items that are ready for the move in that room so you keep it out of the way.  
  • Go on Vacation- Pack and prepare your home for the move before the holidays arrive. Get everything ready to go then get out of town. Even if it is just the next town over, it may help your family relax and will allow you to enjoy the holidays without staring at blank walls, empty rooms, and moving boxes.

Take a look at the number of families who were able move and get settled prior to putting the turkey in the oven…
 

Curious about the value of your home? Get your home's value here!

Chester Springs Home For Sale: 193 Windgate Drive

by Scott Darling

Chester Springs Home For Sale:

193 Windgate Drive, Chester Springs PA 19425
MLS# 6661553

The MOST Spectacular Home!

This is by far, the most spectacular home in all of Weatherstone! Once the model home, 193 Windgate Drive will make you feel comfortable in your own home AND has all the bells and whistles. I’m not even sure that the new construction can compete with this even if they loaded on every option. Some of the most impressive upgrades include the gourmet kitchen with upgraded 42” cabinets, custom crown molding, under cabinet lighting, lots of recessed lighting, hardwood floors, designer architectural columns and a gigantic island with an overhang so you can just chill out with the chef. Adjacent to the kitchen is the formal living room with the gas fireplace, and ceiling mounted speakers for true entertaining. The expansive breakfast room is great for your morning breakfast or your casual meal. The formal dining room with its arched entrance area and designer chandelier has an ambience for both the family dinner and the elegant chef’s masterpiece. Hardwood floors cover the dining room and foyer and lead right into the family room, which is also wired for sound. The walk-thru bar that includes a bar sink and cork floors is located between the living room and family room and works great for small groups or a cozy gathering. It is highlighted by beautiful glass front cabinets and designer lighting. Upstairs you will fall in love with the master suite with hardwood floors and large walk-in closet featuring a very efficient and well laid out California closet system. The gorgeous master bathroom features a Jacuzzi with custom marble and tile surround, separate marble shower stall, recessed lighting and upgraded cabinets and vanity. There are two more good sized bedrooms and a hall bathroom that connects into one of the bedrooms which makes your overnight company feel much more at home. Heading down to the basement will never be the same again. You will be blown away by this totally finished level. The impressive bar seats at least six of your friends and behind the bar are the sink, dishwasher, icemaker, disposal, wine refrigerator and custom tile accents. The back wall of the bar is mirrored and has glass shelves and designer sconces above the custom cabinets and drawers. There are two adjacent seating areas and plenty of room for a pool table or ping pong table. Loaded with recessed lighting you can create any mood you’d like in this area. Moving to the other side of the finished area is a great spot for an office or just another sitting area. Wrapping up this area is the powder room with upgraded vanity and mirror. Lastly, the utility room houses the 2 zoned gas heating system, whole house humidifier and storage. This premium lot backs up to a beautiful green space and is just steps from the Hankin Public Library. Enjoy a cup of coffee on the cozy back deck or on the covered front porch that overlooks Weatherstone Park. As with any former model home, you know you are getting all the best possible upgrades. Schedule your visit today.

Marketed by Chester County PA Realtor Scott Darling.

Chester County PA Real Estate Market Trends -August 2015

by Scott Darling

Take a look at August's real estate sales broken down by school district.

Downingtown School District

The number of homes selling in the Downingtown school district in August 2015 rose by 6.42% when compared to August 2014. The average selling price decreased by 4% to $385,570. The median selling price dropped by  7.96%, while the average market time increased by 9 days.

Date Sold
Listing

Average
Selling Price

Median
Selling Price
Average
Days On Market
August 2015 116 $385,570 $376,450 48
August 2014 109 $401,691 $409,000 39


West Chester School District

The number of homes selling in the West Chester school district in August 2015 decreased by 3.82% when compared to August 2014. The average selling price decreased by less than 1% . The median selling price increased by 3.7 %, while the average market time decreased by 11 days.

Date Sold
Listings

Average
Selling Price

Median
Selling Price
Average
Days On Market
August 2015 126 $394,971 $372,500 38
August 2014 131 $398,558 $359,000 49


Coatesville School District

The number of homes selling in the Coatesville school district in August 2015 increased by 22.06% when compared to August 2014. The average selling price decreased by .35% to $227,766. The median selling price decreased 5.95%, while the average market time rose by 4 days.

Date Sold
Listings

Average
Selling Price

Median
Selling Price
Average
Days On Market
August 2015 83 $227,766 $214,900 78
August 2014 68 $228,559 $228,500 74


Great Valley School District

The number of homes selling in the Great Valley school district increased by 35%. The Average Selling Price increased by 6.02% to $519,733. The median selling price rose by 15%, while the average market time increased by 22 days.

Date Sold
Listings

Average
Selling Price

Median
Selling Price
Average
Days On Market
August 2015 50 $519,733 $460,000 56
August 2014 37 $490,242 $400,000 34


Unionville School District

The number of homes selling in the Unionville school district in August 2015 decreased by 29.17% when compared to August 2014. The average selling price decreased by 21.06% to $495,541. The median selling decreased 18.69% while the average market time increased by 29 days.

Date Sold
Listings

Average
Selling Price

Median
Selling Price
Average
Days On Market
August 2015 34 $495,541 $436,000 78
August 2014 48 $627,708 $536,250 49


Tredyffrin-Easttown School District

The number of homes selling in the Tredyffrin-Easttown school district in
August 2015 decreased by 19.72% when compared to August 2014. The average selling price increased by 7.23% to $531,563. The median selling price increased by 31.49%, while the average market time increased by 10 days.

Date Sold
Listings

Average
Selling Price

Median
Selling Price
Average
Days On Market
August 2015 57 $531,563 $506,250 54
August 2014 71 $495,723 $385,000 44


Owen J Roberts School District

The number of homes selling in the Owen J Roberts school district in
August 2015 increased by 23.81% when compared to August 2014. The average selling price decreased by 12.63% to $340,771. The median selling price rose by 4.64% while the average market time remained the same. 

Date Sold
Listings

Average
Selling Price

Median
Selling Price
Average
Days On Market
August 2015 52 $340,771 $347,000 60
August 2014 42 $390,023 $331,625 60


Phoenixville School District

The number of homes selling in the Phoenixville school district in August 2015 increased by 42.11% when compared to August 2014. The average selling price increased by 10.51% to $309,915. The median selling price rose by 10.9%, while the average market time dropped by 15 days.

Date Sold
Listings

Average
Selling Price

Median
Selling Price
Average
Days On Market
August 2015 54 $309,915 $254,950 43
August 2014 38 $280,444 $229,900 58


Think you’re ready to buy?

Watch this short video to get advice on how to know when you’re ready to buy and find out what you need to get a competitively-priced loan.

Curious about the value of your home? Get your home's value here!

Chester County PA Real Estate Market Trends -July 2015

by Scott Darling

Take a look at July's Chester County PA real estate sales broken down by school district.

Downingtown School District

The number of homes selling in the Downingtown school district in July 2015 dropped by 3.62% when compared to July 2014. The average selling price increased by 16% to $412,524. The median selling price rose by 5.6%, while the average market time decreased by 15 days.

Date Sold
Listings

Average
Selling Price

Median
Selling Price
Average
Days On Market
July 2015 130 $382,254 $372,500 42
July 2014 105 $386,067 $360,000 46


West Chester School District

The number of homes selling in the West Chester school district in July 2015 decreased by less than 1% when compared to July 2014. The average selling price decreased by 13.88% to $384,244. The median selling price decreased by 11.8% while the average market time decreased by 13 days.

Date Sold
Listings

Average
Selling Price

Median
Selling Price
Average
Days On Market
July 2015 138 $370,058 $355,000 36
July 2014 137 $429,687 $402,487 49


Coatesville School District

The number of homes selling in the Coatesville school district in July 2015 increased by 25% when compared to July 2014. The average selling price decreased by 3.64% to $231,849. The median selling price decreased 6.25%, while the average market time rose by 4 days.

Date Sold
Listings

Average
Selling Price

Median
Selling Price
Average
Days On Market
July 2015 75 $225,503 $217,500 56
July 2014 60 $234,019 $232,000 52


Great Valley School District

The number of homes selling in the Great Valley school district in July 2015 increased by 6.38% when compared to July 2014. The average selling price decreased by 10.03% to $524,687. The median selling price dropped by 6.48%, while the average market time decreased by 3 days.

Date Sold
Listings

Average
Selling Price

Median
Selling Price
Average
Days On Market
July 2015 50 $524,687 $411,500 43
July 2014 47 $583,155 $440,000 46


Unionville School District

The number of homes selling in the Unionville school district in July 2015 increased by 12.2% when compared to July 2014. The average selling price decreased by 9.54% to $533,715. The median selling decreased 3.6% while the average market time increased by 8 days.

Date Sold
Listings

Average
Selling Price

Median
Selling Price
Average
Days On Market
July 2015 46 $533,715 $481,250 56
July 2014 41 $590,018 $600,000 48


Tredyffrin-Easttown School District

The number of homes selling in the Tredyffrin-Easttown school district in
July 2015 increased 16.67% when compared to July 2014. The average selling price increased by 10.71% to $614,428. The median selling price increased by 15.47%, while the average market time decreased by 4 days.

Date Sold
Listings

Average
Selling Price

Median
Selling Price
Average
Days On Market
July 2015 84 $614,428 $574,450 34
July 2014 72 $554,967 $497,500 38


Owen J Roberts School District

The number of homes selling in the Owen J Roberts school district in
July 2015 increased by 33.33% when compared to July 2014. The average selling price increased by 13.14% to $385,075. The median selling price rose by 10.77% while the average market time increased by 6 days.  

Date Sold
Listings

Average
Selling Price

Median
Selling Price
Average
Days On Market
July 2015 40 $385,075 $360,000 80
July 2014 3048 $340,353 $325,000 74


Phoenixville School District

The number of homes selling in the Phoenixville school district in July 2015 increased by 9.09% when compared to July 2014. The average selling price increased by 17.44% to $247,520. The median selling price rose by 13.9%, while the average market time dropped by 7 days.

Date Sold
Listings

Average
Selling Price

Median
Selling Price
Average
Days On Market
July 2015 60 $247,520 $276,200 51
July 2014 55 $295,919 $242,500 58


Curious about the value of your home? Get your home's value here!

Chester County PA Real Estate Market Trends - June 2015

by Scott Darling

If you are contemplating putting your house on the market, you may want to see if you have some of the top features home buyers are looking for.

  • A large laundry room is on the list of must-haves for most home buyers these days.  The bigger the better when it comes to laundry rooms. Painting this room a fun color is also a great idea.  If you have not yet updated your washer and dryer it may be a good time to do that as well. 
  • Landscape lighting is a plus if you want your house to stand out above all the others on the market.  Taking a photo of your home at night with all the landscape lighting lit may be a good way to market your home in real estate magazines.  Also if you want to add ambiance to the inside of your house you can add wall lanterns in entrance ways and hallways. 
  • A finished garage is an excellent feature that many home buyers are looking for.  You can add drywall and paint as well as paint the floor of your garage.  You will be amazed at what a difference doing this will make to your home.  Make sure to add a lot of storage areas so that the man of the house will be happy about buying your home. 
  •  An "eat-in" kitchen  is a must have these days.  If you don’t currently have an “eat-in” kitchen, you may want to knock out a wall to make this possible.  It could be the difference of selling your home or not selling your home.  

Take a look at June's real estate sales broken down by school district.

Downingtown School District

The number of homes selling in the Downingtown school district in June 2015 rose by 23.81% when compared to June 2014. The average selling price decreased by 1% to $382,254. The median selling price rose by 3.47%, while the average market time decreased by 4 days.

Date Sold
Listings

Average
Selling Price

Median
Selling Price
Average
Days On Market
June 2015 130 $382,254 $372,500 42
June 2014 105 $386,067 $360,000 46


West Chester School District

The number of homes selling in the West Chester school district in June 2015 increased by 14.38% when compared to June 2014. The average selling price decreased by 2.04% to $384,244. The median selling price increased by 4% while the average market time decreased by 16 days.

Date Sold
Listings

Average
Selling Price

Median
Selling Price
Average
Days On Market
June 2015 175 $384,244 $364,000 34
June 2014 153 $392,247 $350,000 50


Coatesville School District

The number of homes selling in the Coatesville school district in June 2015 the same when compared to June 2014. The average selling price decreased by 5.72% to $231,849. The median selling price decreased 2.39%, while the average market time dropped by 39 days.

Date Sold
Listings

Average
Selling Price

Median
Selling Price
Average
Days On Market
June 2015 72 $231,849 $225,000 38
June 2014 72 $245,917 $230,500 77


Great Valley School District

The number of homes selling in the Great Valley school district in June 2015 increased by 5.88% when compared to June 2014. The average selling price increased 6.53% to $536,846. The median selling price rose by 7.68%, while the average market time decreased by 9 days.

Date Sold
Listings

Average
Selling Price

Median
Selling Price
Average
Days On Market
June 2015 54 $536,846 $438,500 63
June 2014 51 $503,943 $385,000 24


Unionville School District

The number of homes selling in the Unionville school district in June 2015 increased by 23.53% when compared to June 2014. The average selling price increased 17.51% to $626,192. The median selling decreased 3.6% while the average market time increased by 15 days.

Date Sold
Listings

Average
Selling Price

Median
Selling Price
Average
Days On Market
June 2015 42 $626,192 $521,250 87
June 2014 34 $532,880 $540,725 51


Tredyffrin-Easttown School District

The number of homes selling in the Tredyffrin-Easttown school district in
June 2015 increased 27.87% when compared to June 2014. The average selling price decreased by 18% to $504,793. The median selling price remained the same, while the average market time decreased by 22 days.

Date Sold
Listings

Average
Selling Price

Median
Selling Price
Average
Days On Market
June 2015 78 $504,793 $475,000 55
June 2014 61 $615,616 $475,000 33


Owen J Roberts School District

The number of homes selling in the Owen J Roberts school district in
June 2015 increased by 35.42% when compared to June 2014. The average selling price decreased by 5.48% to $387,502. The median selling price dropped by 3.6% while the average market time decreased by 11 days.  

Date Sold
Listings

Average
Selling Price

Median
Selling Price
Average
Days On Market
June 2015 65 $387,502 $335,000 70
June 2014 48 $409,960 $347,500 81


Phoenixville School District

The number of homes selling in the Phoenixville school district in June 2015 increased by 34% when compared to June 2014. The average selling price increased by 2.52% to $292,529. The median selling price rose by 1.2%, while the average market time dropped by 34 days.

Date Sold
Listings

Average
Selling Price

Median
Selling Price
Average
Days On Market
June 2015 67 $292,529 $253,000 43
June 2014 50 $285,334 $250,000 77


Curious about the value of your home? Get your home's value here!

Chester County PA Real Estate Market Trends - May 2015

by Scott Darling

When people dream of vacation homes, oftentimes they cut themselves off quickly, thinking they would never be able to afford one. However, new research by the National Association of REALTORS® shows that is probably not the case. While vacation homes are obviously a big investment, they aren’t out of reach for those under the six-figure salary mark. According to NAR’s 2015 Investment and Vacation Home Buyers Survey, the median household income for those who own a vacation property is $94,380, only about $15,000 more than the median income for those who own their primary residence ($79,650). And if you thought buyers needed cash to buy it, think again—70 percent of vacation homes purchased last year were financed with a mortgage. Considering buying a vacation home? Start your search here!

Take a look at May’s real estate sales broken down by school district.

Downingtown School District

The number of homes selling in the Downingtown school district in May 2015 rose by 34.72% when compared to May 2014. The average selling price increased by 1% to $389,856. The median selling price dropped by 1.17%, while the average market time increased by 6 days.

Date Sold
Listings

Average
Selling Price

Median
Selling Price
Average
Days On Market
May 2015 97 $389,856 $380,000 52
May 2014 72 $386,168 $384,500 46


West Chester School District

The number of homes selling in the West Chester school district in May 2015 decreased by 19.49% when compared to May 2014. The average selling price decreased by .99% to $384,640. The median selling price increased by 5.19% while the average market time decreased by 9 days.

Date Sold
Listings

Average
Selling Price

Median
Selling Price
Average
Days On Market
May 2015 95 $384,640 $370,000 49
May 2014 118 $360,702 $380,875 58


Coatesville School District

The number of homes selling in the Coatesville school district in May 2015 decreased by 1.69% when compared to May 2014. The average selling price decreased by 4.01% to $221,521. The median selling price decreased 6.33%, while the average market time dropped by 15 days.

Date Sold
Listings

Average
Selling Price

Median
Selling Price
Average
Days On Market
May 2015 58 $221,521 $210,750 58
May 2014 59 $230,770 $225,000 73


Great Valley School District

The number of homes selling in the Great Valley school district in May 2015 remained the same when compared to May 2014. The average selling price increased 9.62 % to $447,965. The median selling price rose by 1.3%, while the average market time increased by 39 days.

Date Sold
Listings

Average
Selling Price

Median
Selling Price
Average
Days On Market
May 2015 37 $447,965 $390,000 63
May 2014 37 $408,656 $385,000 24


Unionville School District

The number of homes selling in the Unionville school district in May 2015 increased by 16% when compared to May 2014. The average selling price increased 19.67% to $469,424. The median selling increased 37.98% while the average market time increased by 9 days.

Date Sold
Listings

Average
Selling Price

Median
Selling Price
Average
Days On Market
May 2015 29 $469,424 $465,000 87
May 2014 25 $392,252 $337,000 78


Tredyffrin-Easttown School District

The number of homes selling in the Tredyffrin-Easttown school district in
May 2015 increased 17.39% when compared to May 2014. The average selling price increased by 4.27% to $447,462. The median selling price increased by 11.26% while the average market time decreased by 4 days.

Date Sold
Listings

Average
Selling Price

Median
Selling Price
Average
Days On Market
May 2015 54 $447,462 $420,000 38
May 2014 46 $429,146 $377,500 34


Owen J Roberts School District

The number of homes selling in the Owen J Roberts school district in
May 2015 increased by 7.14% when compared to May 2014. The average selling price decreased by 3.84% to $356,279. The median selling price dropped by 6.01% while the average market time decreased by 18 days.  

Date Sold
Listings

Average
Selling Price

Median
Selling Price
Average
Days On Market
May 2015 45 $356,279 $320,000 69
May 2014 42 $370,511 $340,450 87


Phoenixville School District

The number of homes selling in the Phoenixville school district in May 2015 increased by 3.45% when compared to May 2014. The average selling price decreased by 10.15% to $271,612. The median selling price decreased by 9.39%, while the average market time rose by 1 day.

Date Sold
Listings

Average
Selling Price

Median
Selling Price
Average
Days On Market
May 2015 60 $271,612 $243,750 45
May 2014 58 $302,310 $269,000 44


Curious about the value of your home? Get your home's value here!

Information courtesy of Chester County PA Realtor Scott Darling.
Chester County PA Real Estate Market Trends - April 2015

by Scott Darling

sold signDecades ago, it was not uncommon for people to work at the same job for the entirety of their professional career. Similarly, many people kept the same home their whole lives. Those trends, however, have shifted. Today most homeowners buy and sell several homes throughout their lifetime. The reasons to sell one’s home vary—changes in family situations, neighborhood transformations, financial changes, and many others. However, the most popular reasons sellers decided to leave their home for another are quite simple—people moving to new areas and outgrowing their homes. According to the National Association of REALTORS® 2014 Profile of Home Buyers and Sellers, 15 percent of sellers sold their previous home because the place was too small. That number was much higher (30 percent) among first-time sellers. Additionally, another 15 percent sold their last home due to job relocation. Are you considering selling your home? Get a free current market analysis here.

Take a look at Chester County PA Real Estate Market Trends for April broken down by school district.

Downingtown School District

The number of homes selling in the Downingtown school district in April 2015 rose by 32.73% when compared to April 2014. The average selling price increased by 5% to $381,938. The median selling price increased by 6.45%, while the average market time increased by 9 days.

Date Sold
Listings

Average
Selling Price

Median
Selling Price
Average
Days On Market
Apr 2015 73 $381,938 $341,000 63
Apr 2014 55 $365,468 $320,350 54


West Chester School District

The number of homes selling in the West Chester school district in April 2015 increased by 15.48% when compared to April 2014. The average selling price increased by 12.53% to $405,894. The median selling price increased by 11.28% while the average market time increased by 13 days.

Date Sold
Listings

Average
Selling Price

Median
Selling Price
Average
Days On Market
Apr 2015 97 $405,894 $370,000 75
Apr 2014 84 $360,702 $332,500 62


Coatesville School District

The number of homes selling in the Coatesville school district in April 2015 increased by 12.773% when compared to April 2014. The average selling price decreased by 8.91% to $224,979. The median selling price decreased 10.17%, while the average market time dropped by 1 day.

Date Sold
Listings

Average
Selling Price

Median
Selling Price
Average
Days On Market
Apr 2015 53 $224,979 $220,000 87
Apr 2014 47 $246,996 $244,900 88


Great Valley School District

The number of homes selling in the Great Valley school district in April 2015 increased by 16.67% when compared to April 2014. The average selling price decreased 10.19% to $448,052. The median selling price rose by .34%, while the average market time increased by 10 days.

Date Sold
Listings

Average
Selling Price

Median
Selling Price
Average
Days On Market
Apr 2015 28 $448,052 $445,000 75
Apr 2014 24 $498,907 $443,500 65


Unionville School District

The number of homes selling in the Unionville school district in April 2015 increased by 39.13% when compared to April 2014. The average selling price decreased 5.83% to $418,798. The median selling decreased 1.56% while the average market time dropped by 52 days.

Date Sold
Listings

Average
Selling Price

Median
Selling Price
Average
Days On Market
Apr 2015 32 $439,834 $447,900 66
Apr 2014 23 $467,053 $455,000 118


Tredyffrin-Easttown School District

The number of homes selling in the Tredyffrin-Easttown school district in
April 2015 decreased by 9.3% when compared to April 2014. The average selling price decreased by 3.98% to $399,919. The median selling price dropped by .64% while the average market time decreased by 12 days.

Date Sold
Listings

Average
Selling Price

Median
Selling Price
Average
Days On Market
Apr 2015 39 $399,919 $387,500 40
Apr 2014 43 $416,509 $390,000 52


Owen J Roberts School District

The number of homes selling in the Owen J Roberts school district in
April 2015 increased by 6.25% when compared to April 2014. The average selling price increased by 21.04% to $318,099. The median selling price increased by 25.31% while the average market time rose by 20 days.  

Date Sold
Listings

Average
Selling Price

Median
Selling Price
Average
Days On Market
Apr 2015 34 $318,099 $280,000 116
Apr 2014 32 $262,812 $223,450 96


Phoenixville School District

The number of homes selling in the Phoenixville school district in April 2015 increased by 10.53% when compared to April 2014. The average selling price increased by 13.17% to $215,470. The median selling price increased by 16.1%, while the average market time decreased by 7 days.

Date Sold
Listings

Average
Selling Price

Median
Selling Price
Average
Days On Market
Apr 2015 21 $215,470 $219,900 46
Apr 2014 19 $190,400 $189,400 53


Curious about the value of your home? Get your home's value here!

Information courtesy of Chester County PA Realtor Scott Darling.
Chester County Market Trends Report for March 2015

by Scott Darling

This is a great time to think about buying home. Home prices and interest rates are still at all-time lows and springtime historically offers the most inventory to choose from. The biggest hurdle for many home buyers is saving money for a down payment. Here are 10 things to do on a regular basis to save money:

  1. Make it automatic. Before you see your paycheck, have a percentage of it automatically deposited into your 401(k) and savings.
  2. Keep minimum funds in checking account. Transfer extra funds into your savings account where it will earn more interest than in our checking account.
  3. Don’t pay banking fees! Use your bank’s free bill pay, automatic deposits, free checks, and free reimbursements for all ATM fees.
  4. Use rewards credit cards. Use a credit card offering cash back on every purchase and pay the card off each month to eliminate interest fees.
  5. Actively search out deals. It never hurts to try and find a better deal, or request a better deal from your service providers.
  6. Drive smoothly. Accelerate smoothly and at a reasonable rate, and coast to a stop as often as possible. Also use cruise control on the highway. My car is rated to get 26 mpg around town and I regularly get 29. You can also use these tips to save money on gas, and use gas rewards credit cards to save money on fuel costs.
  7. Buy quality products. Quality items may cost more up front, but they last longer and generally provide better results than cheaper, inferior products. Examples of items you should buy higher quality - furniture, clothes and shoes, vehicles, and other items that will see a lot of use.
  8. Buy generic where applicable. You can save a lot of money on generic items for which the brand name product is essentially the same as the store brand. Food and medicines come to mind as items where generic products are good deals.
  9. Use coupons and rebates. Use coupons for oil changes, groceries, books, on-line purchases, and just about anything else we can find.
  10. Use store rewards cards. Many grocery stores have their own ‘reward cards’ saving you money each time your shop. If you are a senior, shop on designated senior citizen discount days.

Take a look at March’s real estate sales broken down by school district.

Downingtown School District

The number of homes selling in the Downingtown school district in March 2015 rose by 35.19% when compared to March 2014. The average selling price increased by 2% to $364,865. The median selling price increased by 1.92%, while the average market time increased by 28 days.

Date Sold
Listings

Average
Selling Price

Median
Selling Price
Average
Days On Market
Mar 2015 73 $364,865 $332,000 81
Mar 2014 54 $356,104 $325,750 53


West Chester School District

The number of homes selling in the West Chester school district in March 2015 decreased by 10.26% when compared to March 2014. The average selling price increased by less than 1% to $371,708. The median selling price increased by 4.68% while the average market time increased by 17 days.

Date Sold
Listings

Average
Selling Price

Median
Selling Price
Average
Days On Market
Mar 2015 70 $371,708 $341,250 92
Mar 2014 78 $371,035 $326,000 75


Coatesville School District

The number of homes selling in the Coatesville school district in March 2015 increased by 29.73% when compared to March 2014. The average selling price increased 6.53% to $237,735. The median selling price did not change, while the average market time dropped by 2 days.

Date Sold
Listings

Average
Selling Price

Median
Selling Price
Average
Days On Market
Mar 2015 48 $237,735 $225,000 91
Mar 2014 37 $223,156 $225,000 93


Great Valley School District

The number of homes selling in the Great Valley school district in March 2015 decreased by 8.33% when compared to March 2014. The average selling price decreased 17.05% to $356,543. The median selling price dropped by 11.81% to $317,500, while the average market time decreased by 56 days.

Date Sold
Listings

Average
Selling Price

Median
Selling Price
Average
Days On Market
Mar 2015 22 $356,543 $317,500 72
Mar 2014 24 $429,838 $360,000 128


Unionville School District

The number of homes selling in the Unionville school district in March 2015 increased by 15% when compared to March 2014. The average selling price decreased 14.35% to $418,798. The median selling decreased 9.38% while the average market time rose by 3 days.

Date Sold
Listings

Average
Selling Price

Median
Selling Price
Average
Days On Market
Mar 2015 23 $418,798 $435,000 94
Mar 2014 20 $488,937 $480,000 91


Tredyffrin-Easttown School District

The number of homes selling in the Tredyffrin-Easttown school district in March 2015 decreased by 25% when compared to March 2014. The average selling price increased by .06% to $428,441. The median selling price dropped by 8.52% while the average market time increased by 1 day.

Date Sold
Listings

Average
Selling Price

Median
Selling Price
Average
Days On Market
Mar 2015 27 $428,441 $349,900 63
Mar 2014 36 $428,199 $382,500 62


Owen J Roberts School District

The number of homes selling in the Owen J Roberts school district in March 2015 increased by 26.09% when compared to March 2014. The average selling price decreased by 4.72% to $333,536. The median selling price decreased by 23.61% while the average market time dropped by 69 days.  

Date Sold
Listings

Average
Selling Price

Median
Selling Price
Average
Days On Market
Mar 2015 29 $333,536 $275,000 70
Mar 2014 23 $350,055 $360,000 139


Phoenixville School District

The number of homes selling in the Phoenixville school district in March 2015 increased by 62.5% when compared to March 2014. The average selling price decreased 4.4% to $275,037. The median selling price decreased by 10.23%, while the average market time increased by 14 days.

Date Sold
Listings

Average
Selling Price

Median
Selling Price
Average
Days On Market
Mar 2015 39 $275,037 $250,000 101
Mar 2014 24 $287,687 $278,500 87


Curious about the value of your home? Get your home's value here!

Displaying blog entries 31-40 of 81

Syndication

Categories

Archives