Fifty-two percent of home owners say now is a good time to sell in their neighborhood. This is up from 34 percent who said so last year, according to a survey conducted by the real estate brokerage Redfin.
What’s more, 58 percent of home owners believe sellers have more power than buyers in the market right now. Redfin researchers note this is nearly the highest level of seller confidence they’ve recorded.
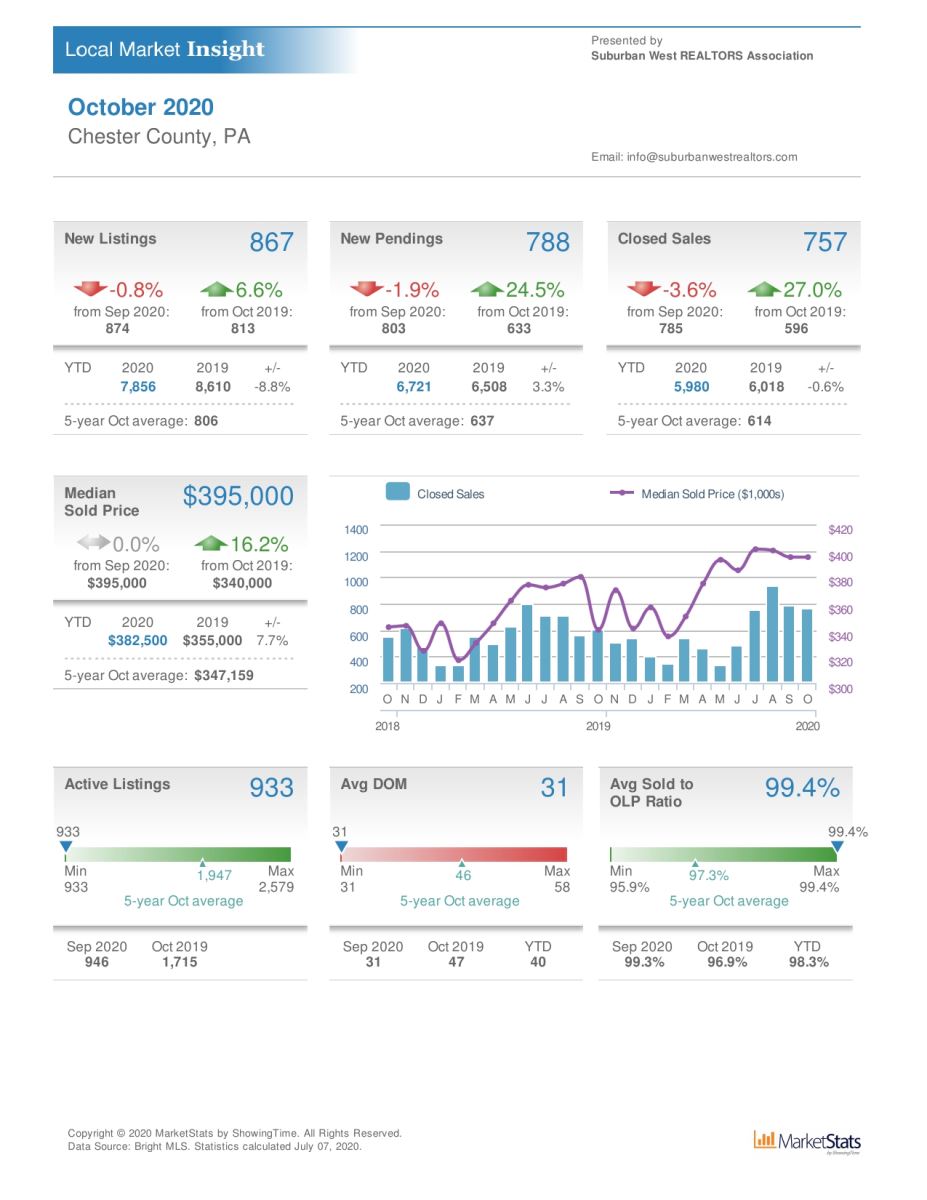
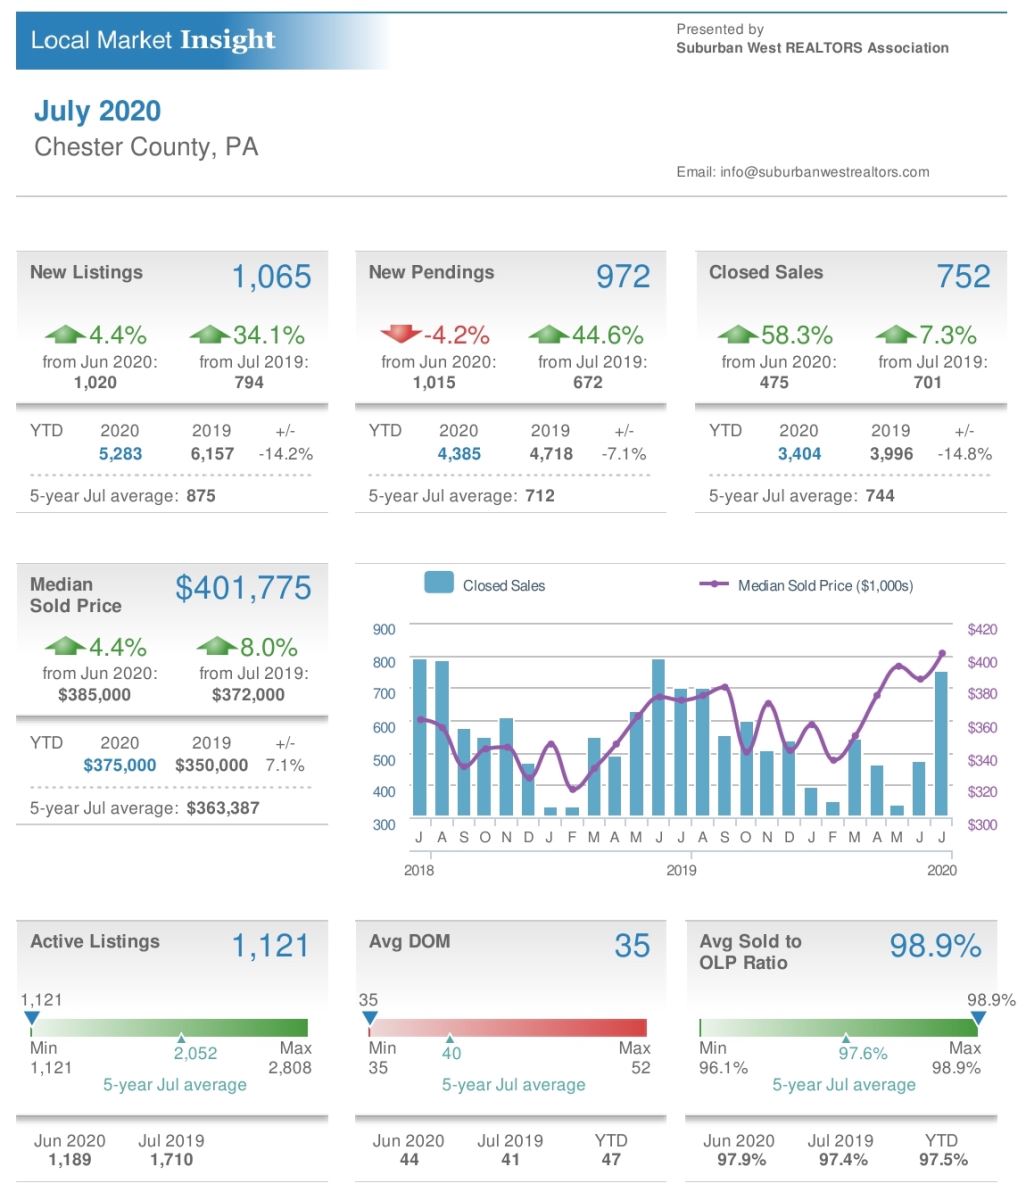
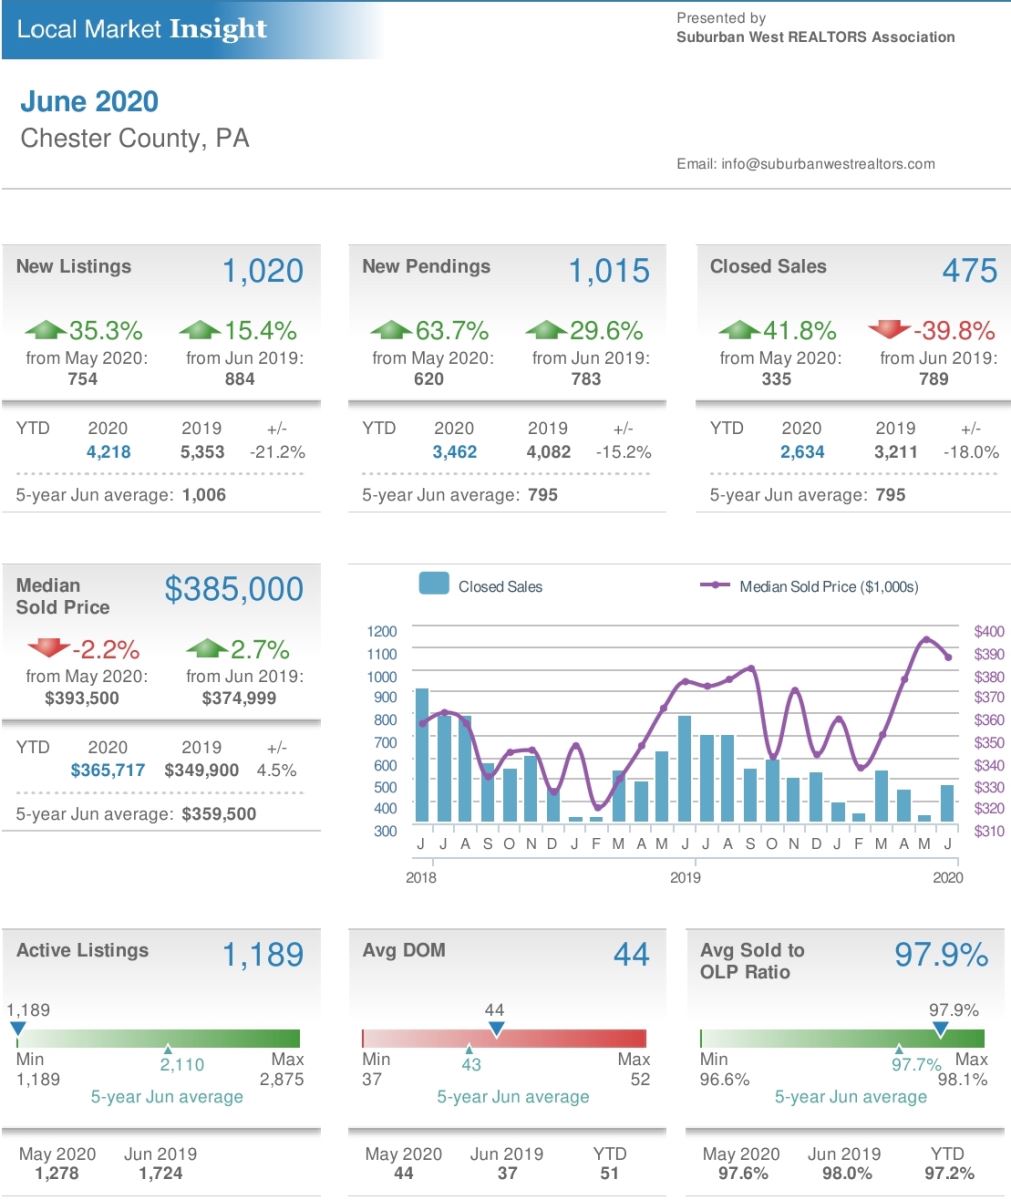
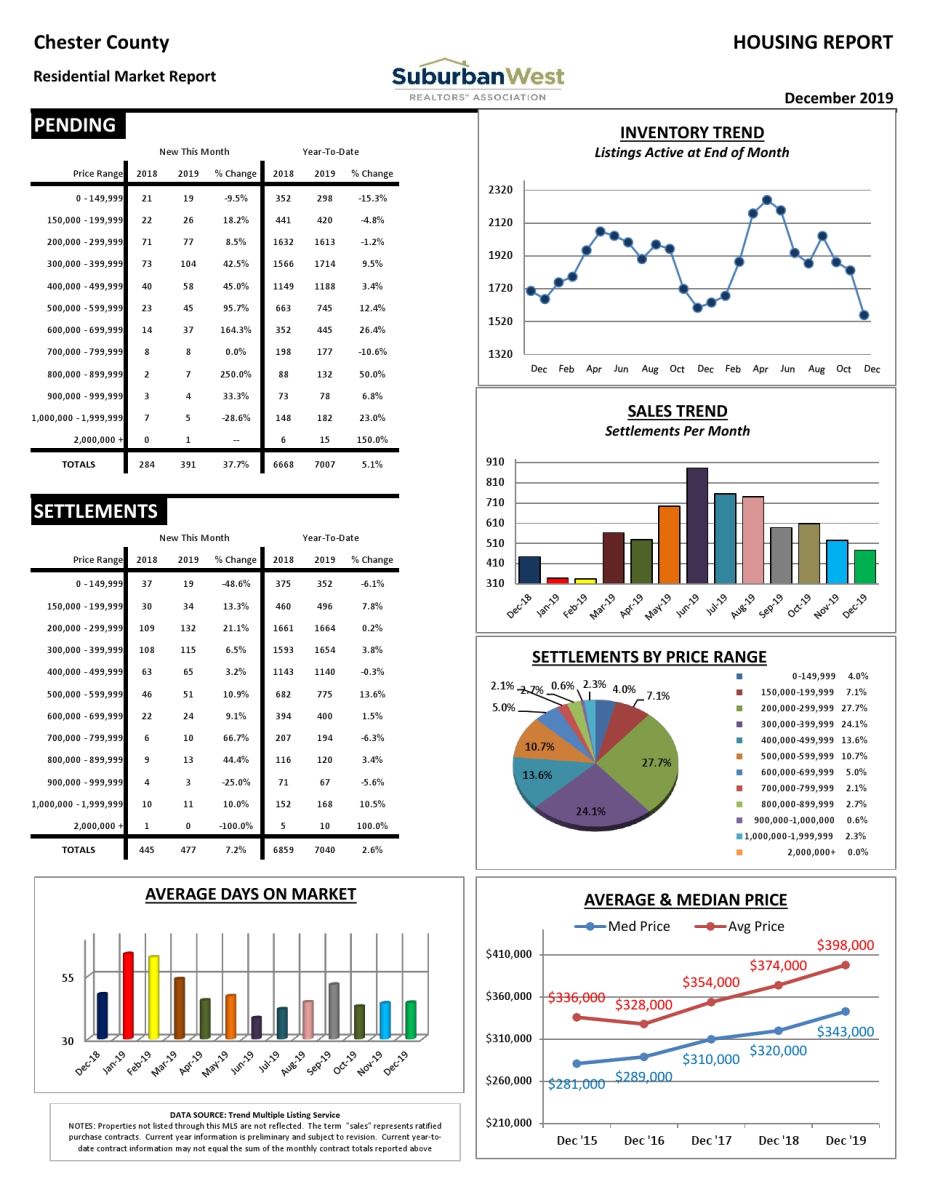
Take a look at how many sellers successfully sold their homes in July…
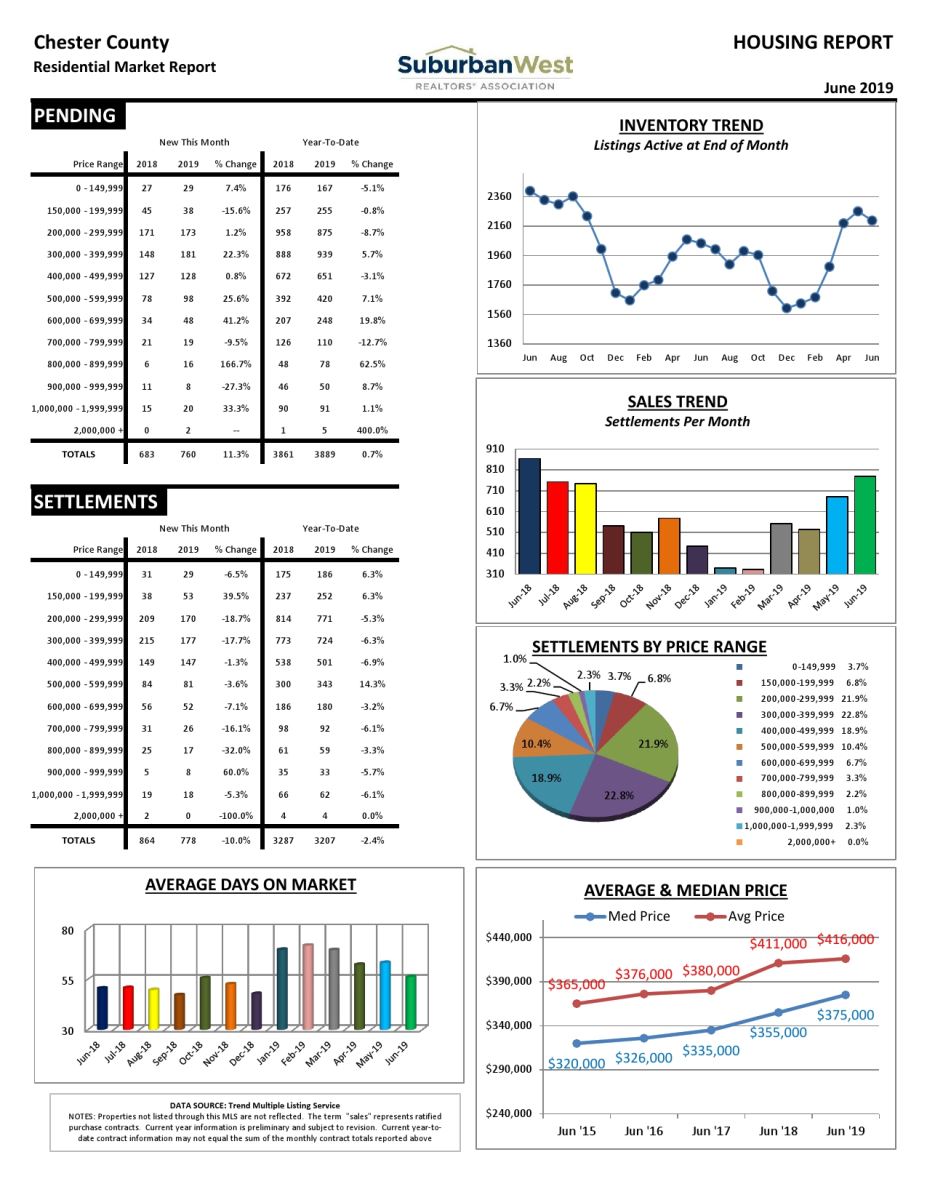
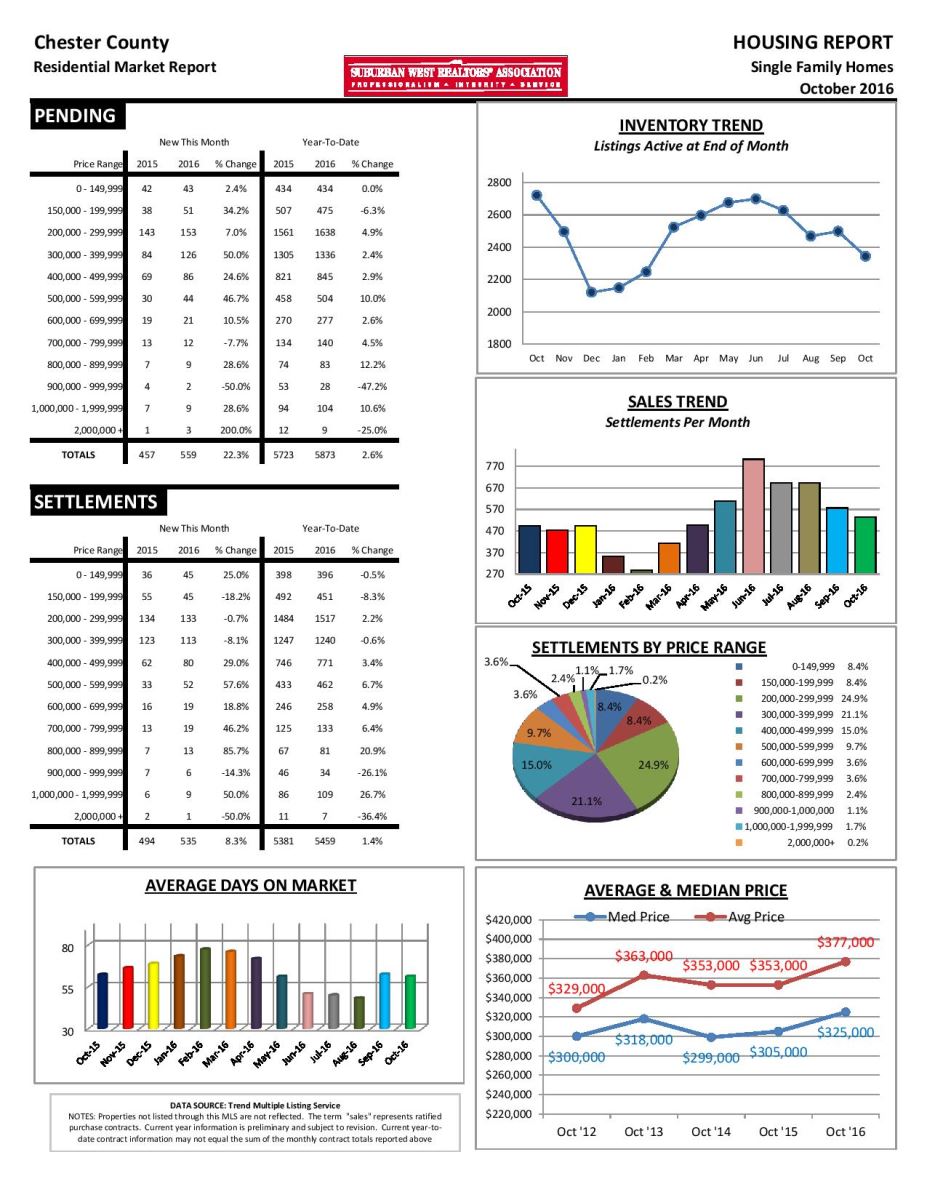
Chester County PA Real Estate Market Trends for July 2016
2,977 Chester County PA single family homes were for sale in July 2016 which is a 6.54% increase from July 2015. 781 homes sold in July with a median sales price of $345,000, a 1.47% increase from July 2015.
The supply of inventory was 5.8 compared to 5.3 in July 2015 and the Sales vs List Price was 95.6%.
| Date |
Homes For
Sale |
Months Supply
Inventory |
Homes
Sold |
Median Sales
Price |
Sales Price vs
List Price |
| July 2016 |
2,977 |
5.8 |
781 |
$345,000 |
95.6% |
| July 2015 |
2,794 |
5.3 |
683 |
$340,000 |
95.7% |
Curious about the value of your home? Get your home's value here!
Courtesy of Chester County PA Realtor Scott Darling.