Real Estate Information Archive

Blog

Displaying blog entries 51-60 of 67

2016 Cost vs Value Report

by Scott Darling
cost vs value

The 2016 Cost vs Value Report shows that home improvement projects relating to curb appeal and energy efficiency had the highest rate of return.

The report compares the average cost of 30 popular remodeling projects against the value of those projects at resale in 100 US markets. The average cost and average return at resale for the 30 projects in this year’s report resulted in an average of 64.4% of a project’s investment dollars getting recouped if the home is sold within a year. That’s up from 62% in the 2015 report and the second-highest return in the past eight years.

Many of the biggest percentage gains were for higher-dollar upscale projects (jobs that are more expansive and complicated than midrange projects). Four of the top five gains in cost recouped were for upscale projects. Topping the list was:

  • fiberglass entry door (energy efficiency project) up 21.2%
  • two-story addition, an 8.1% higher recoupment than in the 2015 report
  • the master suite, up 6.5% and
  • major kitchen remodel, 4.2% higher 

The report is broken down into national results and then regionally. Click here for the full 2016 Cost vs. Value Report and here to view the data specifically for the Philadelphia region.

Courtesy of Chester County PA Realtor Scott Darling.

Chester County Market Trends Report - December 2015

by Scott Darling

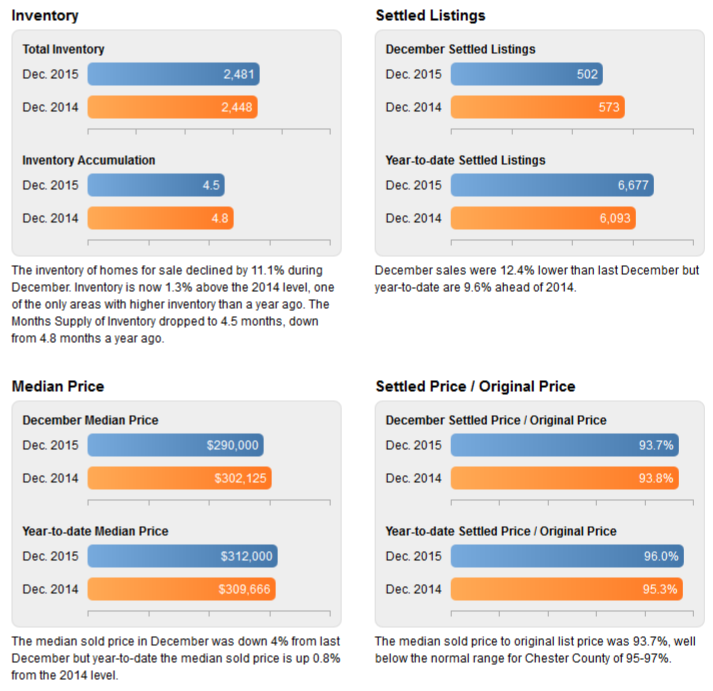
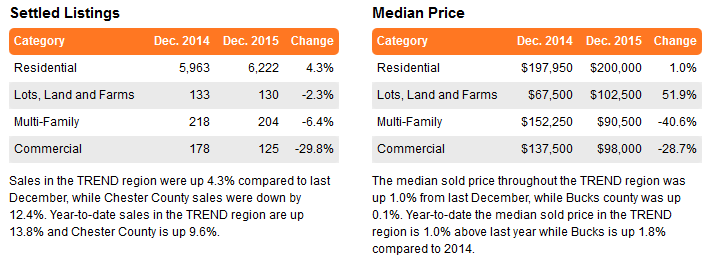
Although Sales increased from last month, they were 12.4% below December 2014. The median sold price was down 4% ($12,125) compared to December 2014.

Residential activity in Chester County (Single-family and Condo)


chester county real estate

What's happening in the Local Market?

Just how good was the 2015 housing market? Although there was a slight slowdown in Q4 of 2015, sales were still 6% higher than Q4 2014. The median sold price, however, was unchanged from Q4 2014. Looking ahead to 2016, most national forecasts are for sales increases of 5% and price increases of 4% in 2016.

chester county real estate

Curious about the value of your home? Get your home's value here!

Chester County PA Real Estate Market Trends - November 2015

by Scott Darling

Realtor.com has ranked the HOTEST Real Estate Markets in November. The temperatures may be dropping but California real estate is hot, hot, hot scoring 12 of the top 20 spots with San Francisco as #1. The good news for the rest of the country is trends always seem to start in California and move eastward. This bodes well for our local market in 2016!

Residential activity in Chester County (Single-family and Condo)


chester county real estate

chester county real estate
 

What's happening in the Local Market?

November was right where expected, sales up, but not by as much as we’ve been seeing, and prices level. Year-to-date sales are up 14% and median sales price is up 2%. Looking ahead to next year as predictions from experts begin to appear: more of the same. Strongest headwinds are low inventory and the probability of mortgage rates increasing, although it’s unlikely that the expected increase to 4.5% by the end of 2016 will adversely impact home sales.

chester county real estate


Curious about the value of your home? Get your home's value here!

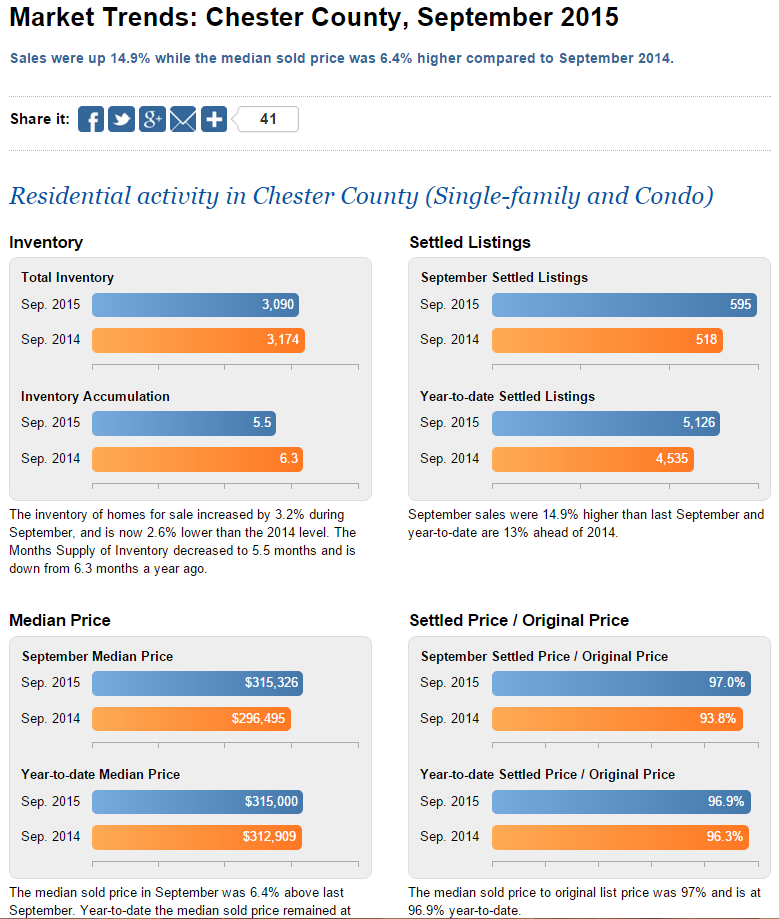
Real Estate Market Trends for Chester County PA - September 2015

by Scott Darling

christmas dog

Moving into a new home during the holidays can be difficult and stressful. There are so many things to plan and prepare when it comes to either event, but to combine the two is extremely difficult. How are you going to celebrate the holidays while you are packing up your home?

If you stay on top of the process you can enjoy the holidays despite your move. Here are some ways you can do both!

  • New Traditions - You might be used to big, homemade meals around the dining room table, but maybe you change it up a bit.  Look for businesses that are open on that day and eat out or order in.  You can have the same sort of meal or you can go completely out of the box. This allows you to pack up your kitchen beforehand so you can enjoy the day more.
  • Create a Move Zone - Keep your jovial, holiday spirit separate from the pile of moving boxes and clutter by creating a moving zone. Put all of your boxes and items that are ready for the move in that room so you keep it out of the way.  
  • Go on Vacation- Pack and prepare your home for the move before the holidays arrive. Get everything ready to go then get out of town. Even if it is just the next town over, it may help your family relax and will allow you to enjoy the holidays without staring at blank walls, empty rooms, and moving boxes.

Take a look at the number of families who were able move and get settled prior to putting the turkey in the oven…
 

Curious about the value of your home? Get your home's value here!

Chester County PA Real Estate Market Trends - September 2015

by Scott Darling

home

A biennial opinion survey on housing issued conducted by the National Association of Realtors shows that fears of selling have abated dramatically since the housing recovery went into high gear two years ago. Over the past two years, homeowners’ confidence in recouping the price they paid for their homes has risen 29 percent. 

Seller confidence extends to their outlook for next year.  Four in ten adults in the survey (41%) expect prices to rise in their market. Some 47 percent said prices will stay the same and only 6 percent expect them to decrease.

Take a look at how many successful sellers there were in our market last month…

September's real estate sales broken down by school district.

Downingtown School District

The number of homes selling in the Downingtown school district in September​ 2015 dropped by 13.68% when compared to September​ 2014. The average selling price decreased by 4% to $336,427. The median selling price dropped by 7.91%, while the average market time decreased by 14 days.

Date Sold
Listing

Average
Selling Price

Median
Selling Price
Average
Days On Market
September​ 2015 82 $336,427 $308,500 42
September​ 2014 95 $350,376 $335,000 56


West Chester School District

The number of homes selling in the West Chester school district in September​ 2015 remained the same when compared to September​ 2014. The average selling price decreased by less than 1% . The median selling price decreased by 0.36%, while the average market time decreased by 2 days.

Date Sold
Listings

Average
Selling Price

Median
Selling Price
Average
Days On Market
September​ 2015 104 $371,516 $348,750 42
September​ 2014 104 $373,299 $350,000 40


Coatesville School District

The number of homes selling in the Coatesville school district in September​ 2015 increased by 29.17% when compared to September​ 2014. The average selling price increased by .45% to $227,766. The median selling price increased 4.92%, while the average market time dropped by 19 days.

Date Sold
Listings

Average
Selling Price

Median
Selling Price
Average
Days On Market
September​t 2015 62 $231,775 $225,000 63
September​ 2014 48 $230,734 $214,450 82


Great Valley School District

The number of homes selling in the Great Valley school district increased by 11.9%. The Average Selling Price decreased by 10.76% to $467,530. The median selling price dropped by 8.22%, while the average market time increased by 34 days.

Date Sold
Listings

Average
Selling Price

Median
Selling Price
Average
Days On Market
September​ 2015 47 $467,530 $385,000 89
September​ 2014 42 $523,926 $419,500 55


Unionville School District

The number of homes selling in the Unionville school district in September​ 2015 increased by 18.52% when compared to September​ 2014. The average selling price increased 21.21% to $472,250. The median selling increased by 11.14% while the average market time increased by 21 days.

Date Sold
Listings

Average
Selling Price

Median
Selling Price
Average
Days On Market
September​ 2015 32 $590,247 $472,250 87
September​ 2014 27 $486,969 $424,900 66


Tredyffrin-Easttown School District

The number of homes selling in the Tredyffrin-Easttown school district in September​ 2015 increased by 35% when compared to September 2014. The average selling price increased by 15.23% to $531,563. The median selling price increased by 21.25%, while the average market time increased by 3 days.

Date Sold
Listings

Average
Selling Price

Median
Selling Price
Average
Days On Market
September​ 2015 54 $529,430 $436,500 66
September​ 2014 40 $459,468 $360,000 63


Owen J Roberts School District

The number of homes selling in the Owen J Roberts school district in September​ 2015 increased by 62.96% when compared to September​ 2014. The average selling price decreased by 5.24% to $340,771. The median selling price rose by 9.28% while the average market time dropped 23 days.

Date Sold
Listings

Average
Selling Price

Median
Selling Price
Average
Days On Market
September​t 2015 44 $331,636 $309,250 59
September​ 2014 27 $349,961 $283,000 82


Phoenixville School District

The number of homes selling in the Phoenixville school district in September​ 2015 decreased 13.33% when compared to September​t 2014. The average selling price increased by 4.48% to $$307,115. The median selling price rose by 11.35%, while the average market time dropped by 16 days.

Date Sold
Listings

Average
Selling Price

Median
Selling Price
Average
Days On Market
September​ 2015 39 $307,115 $279,500 49
September​ 2014 45 $293,938 $251,000 65


Curious about the value of your home? Get your home's value here!

How Much Spook Are You Willing To Live With

by Scott Darling

In honor of Allhallows Eve, Trulia polled 2,005 U.S. adults to find out how men and women react differently to some very eerie home hauntings. You won’t believe which ghoulish living situations men and women find totally acceptable, and which they could really, um, live without.

Chester County PA Real Estate Market Trends -August 2015

by Scott Darling

Take a look at August's real estate sales broken down by school district.

Downingtown School District

The number of homes selling in the Downingtown school district in August 2015 rose by 6.42% when compared to August 2014. The average selling price decreased by 4% to $385,570. The median selling price dropped by  7.96%, while the average market time increased by 9 days.

Date Sold
Listing

Average
Selling Price

Median
Selling Price
Average
Days On Market
August 2015 116 $385,570 $376,450 48
August 2014 109 $401,691 $409,000 39


West Chester School District

The number of homes selling in the West Chester school district in August 2015 decreased by 3.82% when compared to August 2014. The average selling price decreased by less than 1% . The median selling price increased by 3.7 %, while the average market time decreased by 11 days.

Date Sold
Listings

Average
Selling Price

Median
Selling Price
Average
Days On Market
August 2015 126 $394,971 $372,500 38
August 2014 131 $398,558 $359,000 49


Coatesville School District

The number of homes selling in the Coatesville school district in August 2015 increased by 22.06% when compared to August 2014. The average selling price decreased by .35% to $227,766. The median selling price decreased 5.95%, while the average market time rose by 4 days.

Date Sold
Listings

Average
Selling Price

Median
Selling Price
Average
Days On Market
August 2015 83 $227,766 $214,900 78
August 2014 68 $228,559 $228,500 74


Great Valley School District

The number of homes selling in the Great Valley school district increased by 35%. The Average Selling Price increased by 6.02% to $519,733. The median selling price rose by 15%, while the average market time increased by 22 days.

Date Sold
Listings

Average
Selling Price

Median
Selling Price
Average
Days On Market
August 2015 50 $519,733 $460,000 56
August 2014 37 $490,242 $400,000 34


Unionville School District

The number of homes selling in the Unionville school district in August 2015 decreased by 29.17% when compared to August 2014. The average selling price decreased by 21.06% to $495,541. The median selling decreased 18.69% while the average market time increased by 29 days.

Date Sold
Listings

Average
Selling Price

Median
Selling Price
Average
Days On Market
August 2015 34 $495,541 $436,000 78
August 2014 48 $627,708 $536,250 49


Tredyffrin-Easttown School District

The number of homes selling in the Tredyffrin-Easttown school district in
August 2015 decreased by 19.72% when compared to August 2014. The average selling price increased by 7.23% to $531,563. The median selling price increased by 31.49%, while the average market time increased by 10 days.

Date Sold
Listings

Average
Selling Price

Median
Selling Price
Average
Days On Market
August 2015 57 $531,563 $506,250 54
August 2014 71 $495,723 $385,000 44


Owen J Roberts School District

The number of homes selling in the Owen J Roberts school district in
August 2015 increased by 23.81% when compared to August 2014. The average selling price decreased by 12.63% to $340,771. The median selling price rose by 4.64% while the average market time remained the same. 

Date Sold
Listings

Average
Selling Price

Median
Selling Price
Average
Days On Market
August 2015 52 $340,771 $347,000 60
August 2014 42 $390,023 $331,625 60


Phoenixville School District

The number of homes selling in the Phoenixville school district in August 2015 increased by 42.11% when compared to August 2014. The average selling price increased by 10.51% to $309,915. The median selling price rose by 10.9%, while the average market time dropped by 15 days.

Date Sold
Listings

Average
Selling Price

Median
Selling Price
Average
Days On Market
August 2015 54 $309,915 $254,950 43
August 2014 38 $280,444 $229,900 58


Think you’re ready to buy?

Watch this short video to get advice on how to know when you’re ready to buy and find out what you need to get a competitively-priced loan.

Curious about the value of your home? Get your home's value here!

Chester County PA Real Estate Market Trends -July 2015

by Scott Darling

Take a look at July's Chester County PA real estate sales broken down by school district.

Downingtown School District

The number of homes selling in the Downingtown school district in July 2015 dropped by 3.62% when compared to July 2014. The average selling price increased by 16% to $412,524. The median selling price rose by 5.6%, while the average market time decreased by 15 days.

Date Sold
Listings

Average
Selling Price

Median
Selling Price
Average
Days On Market
July 2015 130 $382,254 $372,500 42
July 2014 105 $386,067 $360,000 46


West Chester School District

The number of homes selling in the West Chester school district in July 2015 decreased by less than 1% when compared to July 2014. The average selling price decreased by 13.88% to $384,244. The median selling price decreased by 11.8% while the average market time decreased by 13 days.

Date Sold
Listings

Average
Selling Price

Median
Selling Price
Average
Days On Market
July 2015 138 $370,058 $355,000 36
July 2014 137 $429,687 $402,487 49


Coatesville School District

The number of homes selling in the Coatesville school district in July 2015 increased by 25% when compared to July 2014. The average selling price decreased by 3.64% to $231,849. The median selling price decreased 6.25%, while the average market time rose by 4 days.

Date Sold
Listings

Average
Selling Price

Median
Selling Price
Average
Days On Market
July 2015 75 $225,503 $217,500 56
July 2014 60 $234,019 $232,000 52


Great Valley School District

The number of homes selling in the Great Valley school district in July 2015 increased by 6.38% when compared to July 2014. The average selling price decreased by 10.03% to $524,687. The median selling price dropped by 6.48%, while the average market time decreased by 3 days.

Date Sold
Listings

Average
Selling Price

Median
Selling Price
Average
Days On Market
July 2015 50 $524,687 $411,500 43
July 2014 47 $583,155 $440,000 46


Unionville School District

The number of homes selling in the Unionville school district in July 2015 increased by 12.2% when compared to July 2014. The average selling price decreased by 9.54% to $533,715. The median selling decreased 3.6% while the average market time increased by 8 days.

Date Sold
Listings

Average
Selling Price

Median
Selling Price
Average
Days On Market
July 2015 46 $533,715 $481,250 56
July 2014 41 $590,018 $600,000 48


Tredyffrin-Easttown School District

The number of homes selling in the Tredyffrin-Easttown school district in
July 2015 increased 16.67% when compared to July 2014. The average selling price increased by 10.71% to $614,428. The median selling price increased by 15.47%, while the average market time decreased by 4 days.

Date Sold
Listings

Average
Selling Price

Median
Selling Price
Average
Days On Market
July 2015 84 $614,428 $574,450 34
July 2014 72 $554,967 $497,500 38


Owen J Roberts School District

The number of homes selling in the Owen J Roberts school district in
July 2015 increased by 33.33% when compared to July 2014. The average selling price increased by 13.14% to $385,075. The median selling price rose by 10.77% while the average market time increased by 6 days.  

Date Sold
Listings

Average
Selling Price

Median
Selling Price
Average
Days On Market
July 2015 40 $385,075 $360,000 80
July 2014 3048 $340,353 $325,000 74


Phoenixville School District

The number of homes selling in the Phoenixville school district in July 2015 increased by 9.09% when compared to July 2014. The average selling price increased by 17.44% to $247,520. The median selling price rose by 13.9%, while the average market time dropped by 7 days.

Date Sold
Listings

Average
Selling Price

Median
Selling Price
Average
Days On Market
July 2015 60 $247,520 $276,200 51
July 2014 55 $295,919 $242,500 58


Curious about the value of your home? Get your home's value here!

Chester County PA Real Estate Market Trends - June 2015

by Scott Darling

If you are contemplating putting your house on the market, you may want to see if you have some of the top features home buyers are looking for.

  • A large laundry room is on the list of must-haves for most home buyers these days.  The bigger the better when it comes to laundry rooms. Painting this room a fun color is also a great idea.  If you have not yet updated your washer and dryer it may be a good time to do that as well. 
  • Landscape lighting is a plus if you want your house to stand out above all the others on the market.  Taking a photo of your home at night with all the landscape lighting lit may be a good way to market your home in real estate magazines.  Also if you want to add ambiance to the inside of your house you can add wall lanterns in entrance ways and hallways. 
  • A finished garage is an excellent feature that many home buyers are looking for.  You can add drywall and paint as well as paint the floor of your garage.  You will be amazed at what a difference doing this will make to your home.  Make sure to add a lot of storage areas so that the man of the house will be happy about buying your home. 
  •  An "eat-in" kitchen  is a must have these days.  If you don’t currently have an “eat-in” kitchen, you may want to knock out a wall to make this possible.  It could be the difference of selling your home or not selling your home.  

Take a look at June's real estate sales broken down by school district.

Downingtown School District

The number of homes selling in the Downingtown school district in June 2015 rose by 23.81% when compared to June 2014. The average selling price decreased by 1% to $382,254. The median selling price rose by 3.47%, while the average market time decreased by 4 days.

Date Sold
Listings

Average
Selling Price

Median
Selling Price
Average
Days On Market
June 2015 130 $382,254 $372,500 42
June 2014 105 $386,067 $360,000 46


West Chester School District

The number of homes selling in the West Chester school district in June 2015 increased by 14.38% when compared to June 2014. The average selling price decreased by 2.04% to $384,244. The median selling price increased by 4% while the average market time decreased by 16 days.

Date Sold
Listings

Average
Selling Price

Median
Selling Price
Average
Days On Market
June 2015 175 $384,244 $364,000 34
June 2014 153 $392,247 $350,000 50


Coatesville School District

The number of homes selling in the Coatesville school district in June 2015 the same when compared to June 2014. The average selling price decreased by 5.72% to $231,849. The median selling price decreased 2.39%, while the average market time dropped by 39 days.

Date Sold
Listings

Average
Selling Price

Median
Selling Price
Average
Days On Market
June 2015 72 $231,849 $225,000 38
June 2014 72 $245,917 $230,500 77


Great Valley School District

The number of homes selling in the Great Valley school district in June 2015 increased by 5.88% when compared to June 2014. The average selling price increased 6.53% to $536,846. The median selling price rose by 7.68%, while the average market time decreased by 9 days.

Date Sold
Listings

Average
Selling Price

Median
Selling Price
Average
Days On Market
June 2015 54 $536,846 $438,500 63
June 2014 51 $503,943 $385,000 24


Unionville School District

The number of homes selling in the Unionville school district in June 2015 increased by 23.53% when compared to June 2014. The average selling price increased 17.51% to $626,192. The median selling decreased 3.6% while the average market time increased by 15 days.

Date Sold
Listings

Average
Selling Price

Median
Selling Price
Average
Days On Market
June 2015 42 $626,192 $521,250 87
June 2014 34 $532,880 $540,725 51


Tredyffrin-Easttown School District

The number of homes selling in the Tredyffrin-Easttown school district in
June 2015 increased 27.87% when compared to June 2014. The average selling price decreased by 18% to $504,793. The median selling price remained the same, while the average market time decreased by 22 days.

Date Sold
Listings

Average
Selling Price

Median
Selling Price
Average
Days On Market
June 2015 78 $504,793 $475,000 55
June 2014 61 $615,616 $475,000 33


Owen J Roberts School District

The number of homes selling in the Owen J Roberts school district in
June 2015 increased by 35.42% when compared to June 2014. The average selling price decreased by 5.48% to $387,502. The median selling price dropped by 3.6% while the average market time decreased by 11 days.  

Date Sold
Listings

Average
Selling Price

Median
Selling Price
Average
Days On Market
June 2015 65 $387,502 $335,000 70
June 2014 48 $409,960 $347,500 81


Phoenixville School District

The number of homes selling in the Phoenixville school district in June 2015 increased by 34% when compared to June 2014. The average selling price increased by 2.52% to $292,529. The median selling price rose by 1.2%, while the average market time dropped by 34 days.

Date Sold
Listings

Average
Selling Price

Median
Selling Price
Average
Days On Market
June 2015 67 $292,529 $253,000 43
June 2014 50 $285,334 $250,000 77


Curious about the value of your home? Get your home's value here!

Chester County PA Real Estate Market Trends - May 2015

by Scott Darling

When people dream of vacation homes, oftentimes they cut themselves off quickly, thinking they would never be able to afford one. However, new research by the National Association of REALTORS® shows that is probably not the case. While vacation homes are obviously a big investment, they aren’t out of reach for those under the six-figure salary mark. According to NAR’s 2015 Investment and Vacation Home Buyers Survey, the median household income for those who own a vacation property is $94,380, only about $15,000 more than the median income for those who own their primary residence ($79,650). And if you thought buyers needed cash to buy it, think again—70 percent of vacation homes purchased last year were financed with a mortgage. Considering buying a vacation home? Start your search here!

Take a look at May’s real estate sales broken down by school district.

Downingtown School District

The number of homes selling in the Downingtown school district in May 2015 rose by 34.72% when compared to May 2014. The average selling price increased by 1% to $389,856. The median selling price dropped by 1.17%, while the average market time increased by 6 days.

Date Sold
Listings

Average
Selling Price

Median
Selling Price
Average
Days On Market
May 2015 97 $389,856 $380,000 52
May 2014 72 $386,168 $384,500 46


West Chester School District

The number of homes selling in the West Chester school district in May 2015 decreased by 19.49% when compared to May 2014. The average selling price decreased by .99% to $384,640. The median selling price increased by 5.19% while the average market time decreased by 9 days.

Date Sold
Listings

Average
Selling Price

Median
Selling Price
Average
Days On Market
May 2015 95 $384,640 $370,000 49
May 2014 118 $360,702 $380,875 58


Coatesville School District

The number of homes selling in the Coatesville school district in May 2015 decreased by 1.69% when compared to May 2014. The average selling price decreased by 4.01% to $221,521. The median selling price decreased 6.33%, while the average market time dropped by 15 days.

Date Sold
Listings

Average
Selling Price

Median
Selling Price
Average
Days On Market
May 2015 58 $221,521 $210,750 58
May 2014 59 $230,770 $225,000 73


Great Valley School District

The number of homes selling in the Great Valley school district in May 2015 remained the same when compared to May 2014. The average selling price increased 9.62 % to $447,965. The median selling price rose by 1.3%, while the average market time increased by 39 days.

Date Sold
Listings

Average
Selling Price

Median
Selling Price
Average
Days On Market
May 2015 37 $447,965 $390,000 63
May 2014 37 $408,656 $385,000 24


Unionville School District

The number of homes selling in the Unionville school district in May 2015 increased by 16% when compared to May 2014. The average selling price increased 19.67% to $469,424. The median selling increased 37.98% while the average market time increased by 9 days.

Date Sold
Listings

Average
Selling Price

Median
Selling Price
Average
Days On Market
May 2015 29 $469,424 $465,000 87
May 2014 25 $392,252 $337,000 78


Tredyffrin-Easttown School District

The number of homes selling in the Tredyffrin-Easttown school district in
May 2015 increased 17.39% when compared to May 2014. The average selling price increased by 4.27% to $447,462. The median selling price increased by 11.26% while the average market time decreased by 4 days.

Date Sold
Listings

Average
Selling Price

Median
Selling Price
Average
Days On Market
May 2015 54 $447,462 $420,000 38
May 2014 46 $429,146 $377,500 34


Owen J Roberts School District

The number of homes selling in the Owen J Roberts school district in
May 2015 increased by 7.14% when compared to May 2014. The average selling price decreased by 3.84% to $356,279. The median selling price dropped by 6.01% while the average market time decreased by 18 days.  

Date Sold
Listings

Average
Selling Price

Median
Selling Price
Average
Days On Market
May 2015 45 $356,279 $320,000 69
May 2014 42 $370,511 $340,450 87


Phoenixville School District

The number of homes selling in the Phoenixville school district in May 2015 increased by 3.45% when compared to May 2014. The average selling price decreased by 10.15% to $271,612. The median selling price decreased by 9.39%, while the average market time rose by 1 day.

Date Sold
Listings

Average
Selling Price

Median
Selling Price
Average
Days On Market
May 2015 60 $271,612 $243,750 45
May 2014 58 $302,310 $269,000 44


Curious about the value of your home? Get your home's value here!

Information courtesy of Chester County PA Realtor Scott Darling.

Displaying blog entries 51-60 of 67

Syndication

Categories

Archives